How to calculate the hit rate of a Memcached ElastiCache in CloudWatch
Monitoring a Memcached instance is essential in determining its effectiveness. Looking at the right metrics can help answer important questions. Is your caching strategy working as expected? Are there bugs that need to be addressed?
Amazon CloudWatch offers a ton of metrics out of the box. A key metric to determine caching performance is missing however; hit rate.
What is hit rate?
Hit rate, or hit ratio, is the main measure of performance for your cache requests (hits and misses). It is calculated by dividing the number of cache hits by the total number of cache hits and misses. It tells us how effective a cache is at fulfilling requests.
The hit rate easily highlights poor cache performance. For example, a low hit rate, e.g., below 80%, depending on your caching strategy, could indicated that your cache is too small. In that case, a solution could be increasing your cache size so it can hold more data, resulting in fewer misses and a higher hit rate.
Let’s create a custom hit rate metric using CloudWatch Math expressions.
Prerequisites
- An AWS account. If you haven’t used AWS before, you can set up an account.
- A Memcached ElastiCache
Out of the box CloudWatch metrics
Log in to AWS, go the ElastiCache service, select Memcached, then your cluster, then a node. Notice the default CloudWatch metrics appear below.
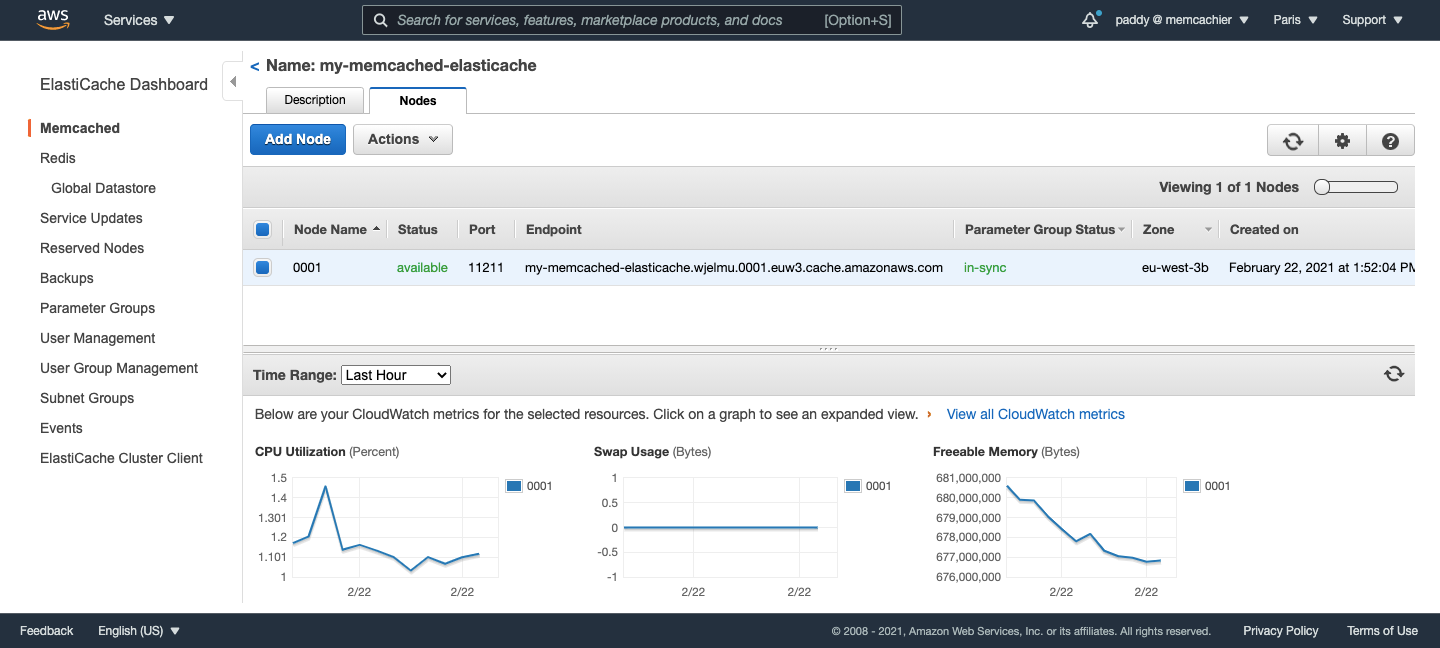
There is no hit rate metric in sight though. Let’s remedy that.
Create a custom hit rate metric
To start, create a new CloudWatch dashboard with a Line widget, using Metrics as the data source.
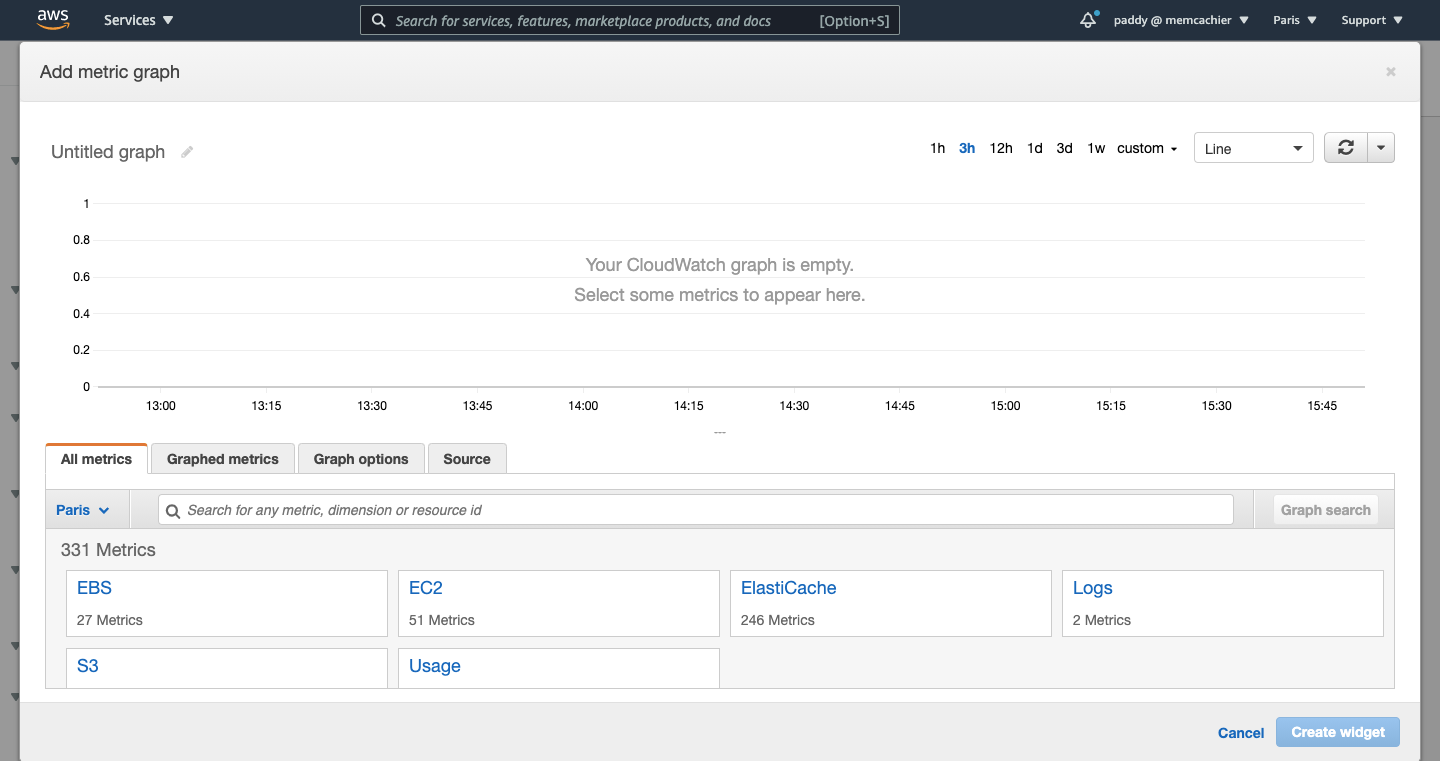
You will now see an empty metric graph, ready to display our hit rate metric.
Name the graph by changing ‘Untitled graph’ to ‘Hit rate’, or whatever you like.
Next, we’ll add all metrics required for calculating our cache hit rate.
Hit rate calculation
What metrics do we require? Hit rate is calculated as follows:
hits / (hits + misses)
With Memcached we have 5 types of requests, get, delete, incr, decr, and touch. Each request can result in a hit or a miss, so our calculation requires a total of 10 metrics, becoming:
(GetHits + DeleteHits + IncrHits + DecrHits + TouchHits) /
(GetHits + DeleteHits + IncrHits + DecrHits + TouchHits +
GetMisses + DeleteMisses + IncrMisses + DecrMisses + TouchMisses)
That’s a bit of a mouthful, but CloudWatch Math expressions help simplify things.
Adding the required metrics
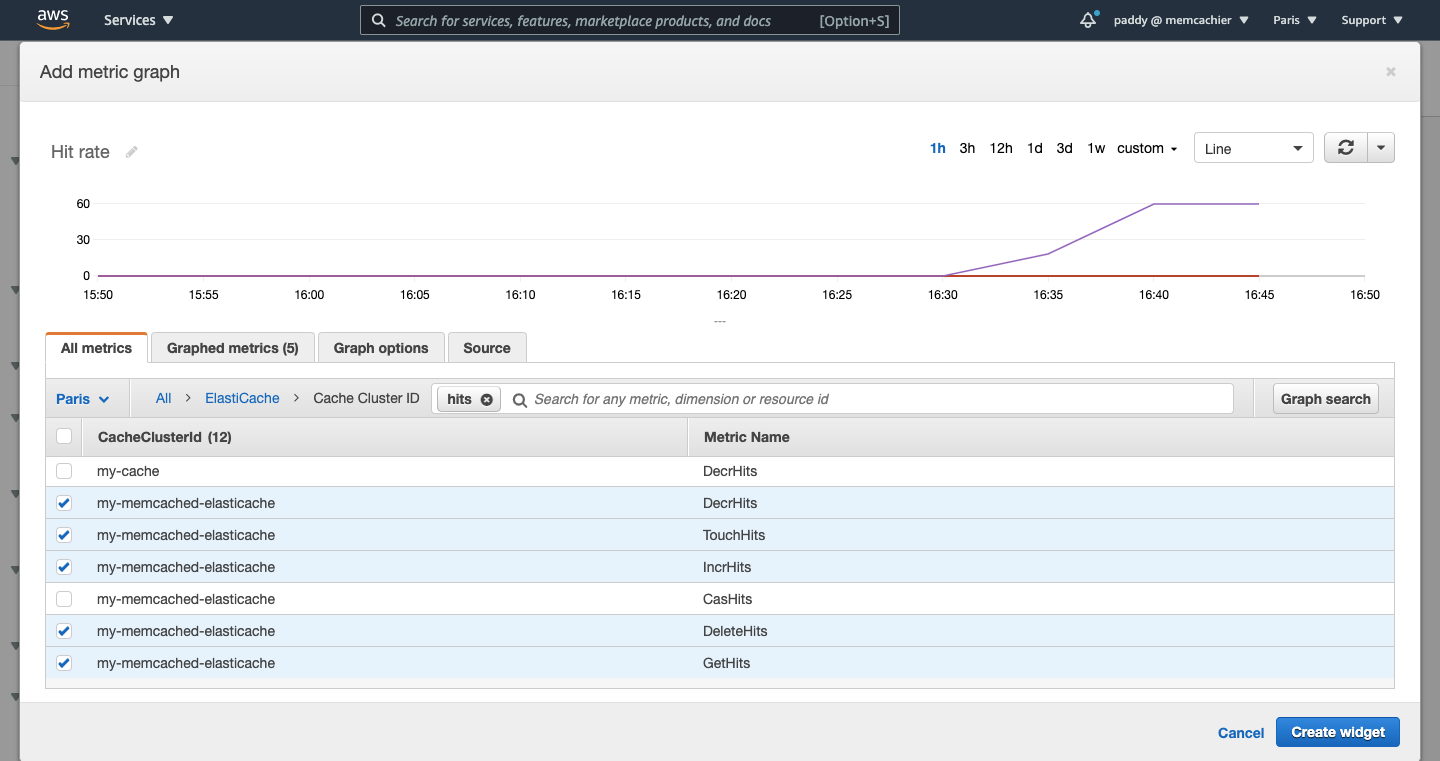
In the ‘All Metrics’ tab of our widget, click the ‘ElastiCache’ box, then ‘Cache Cluster ID’ as we’ll be calculating the hit rate of our ElastiCache cluster.
Note, it’s possible to calculate the same for a specific node in a cluster, or as an aggregate across all clusters.
First, we add the 5 hit metrics. In the ‘All Metrics’ tab search for ‘hits’, and select all 5 hit metrics corresponding to your CacheClusterID (GetHits, DeleteHits, IncrHits, DecrHits, TouchHits). My cluster ID is ‘cloudwatch-research’.
Next, search for ‘misses’ and add all 5 miss metrics (GetMisses, DeleteMisses, IncrMisses, DecrMisses, TouchHits).
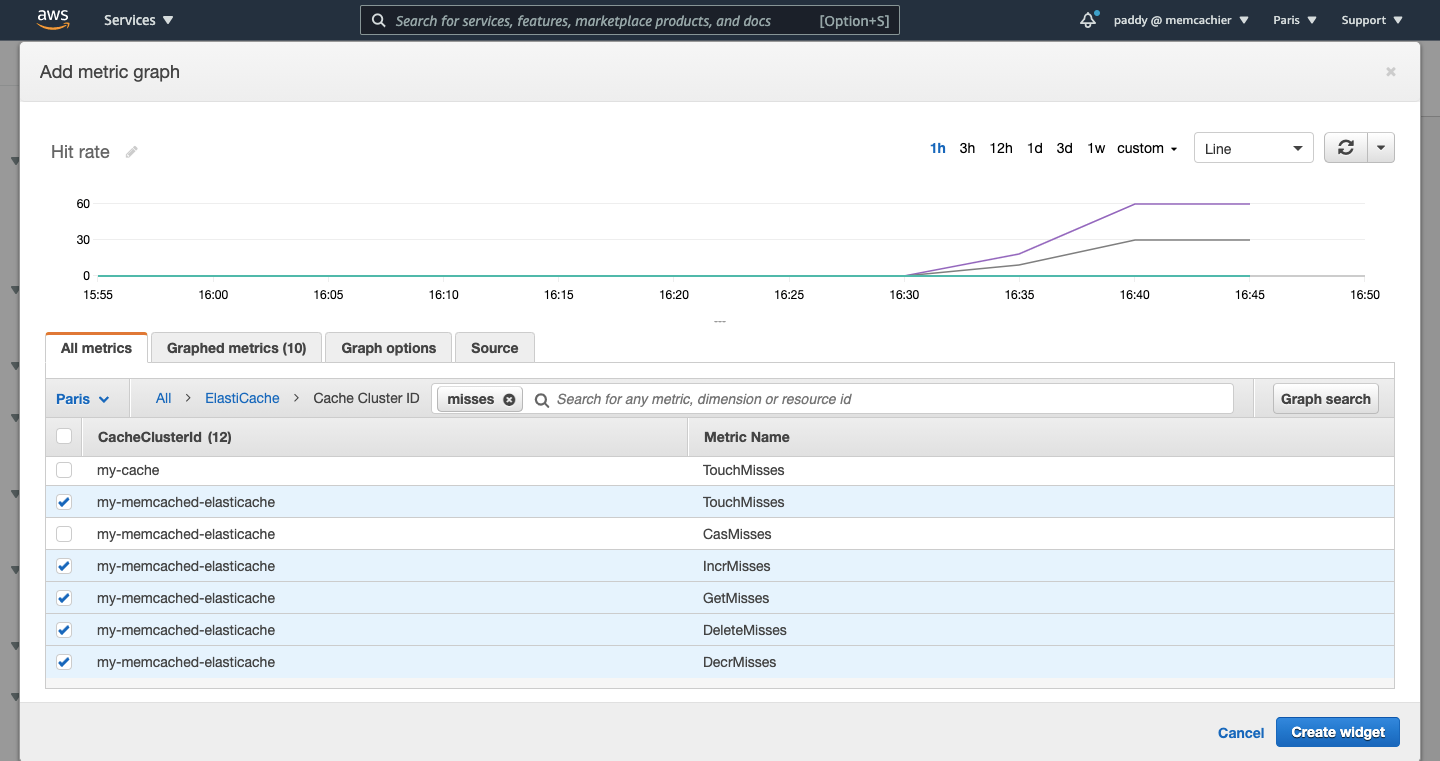
Click on ‘Graphed metrics’ to see all 10 metrics we just added.
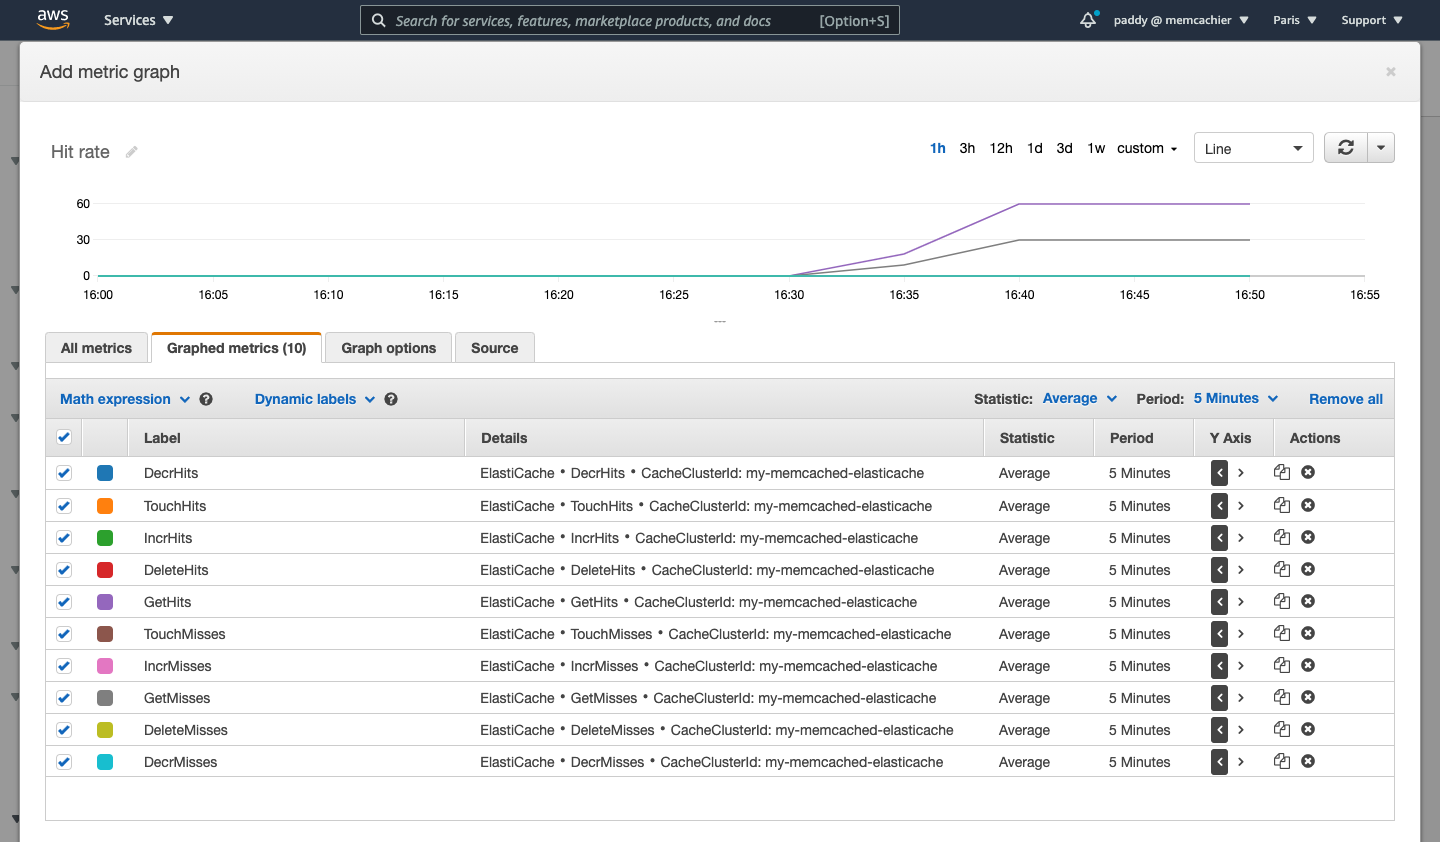
Math expressions
We’ll use CloudWatch Math expressions to calculate a couple of values for convenience before calculating our overall hit rate.
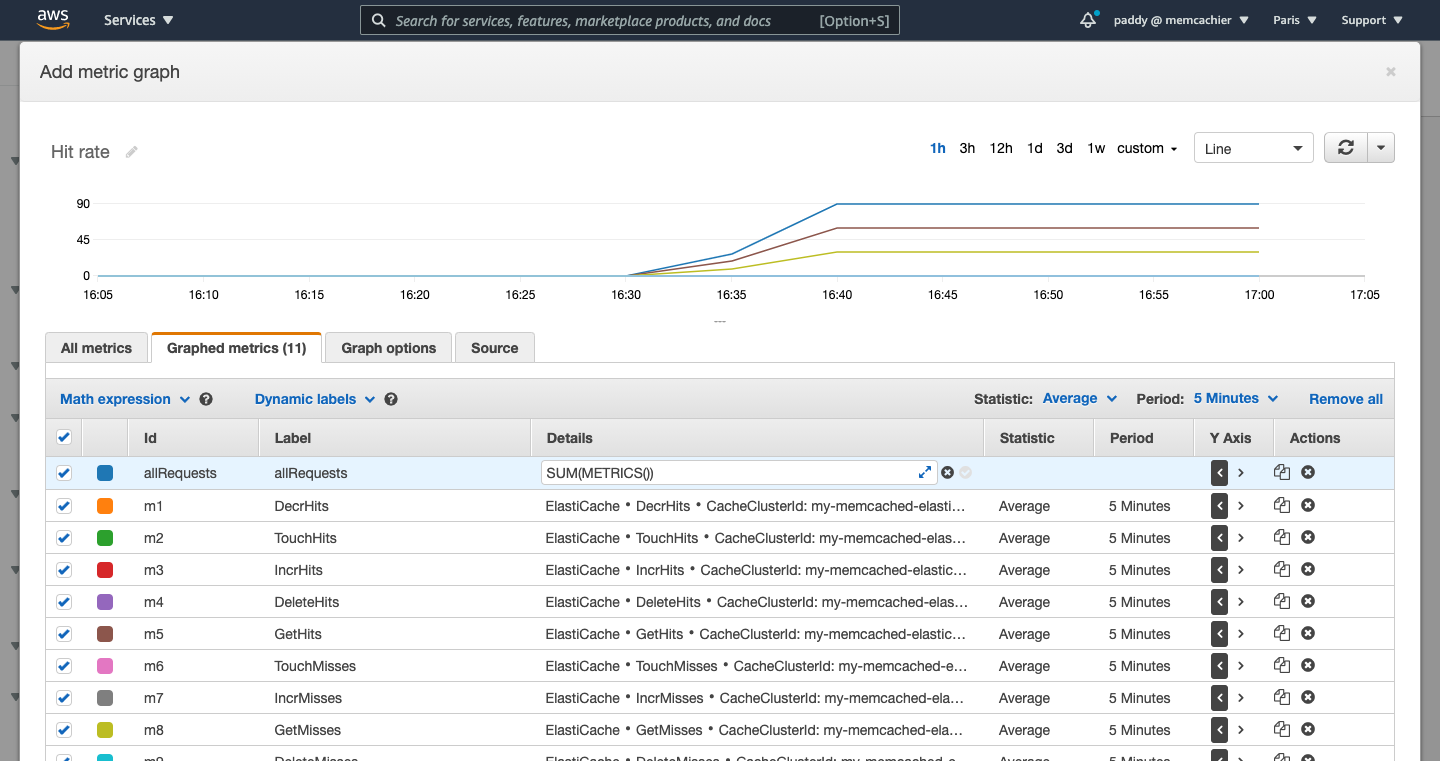
Still on the ‘Graphed metrics’ tab, click ‘Math expression’, hover over ‘All Functions’, and click ‘SUM’. This will create the following expression, SUM(METRICS()).
The METRICS() function returns all of our graphed metrics, excluding Math expressions. And SUM(), as you might guess, sums up whatever arguments it receives. So this will conveniently sum up all of our requests.
Set the ID and Label for this expression to ‘allRequests’.
Next, let’s calculate only the hit requests.
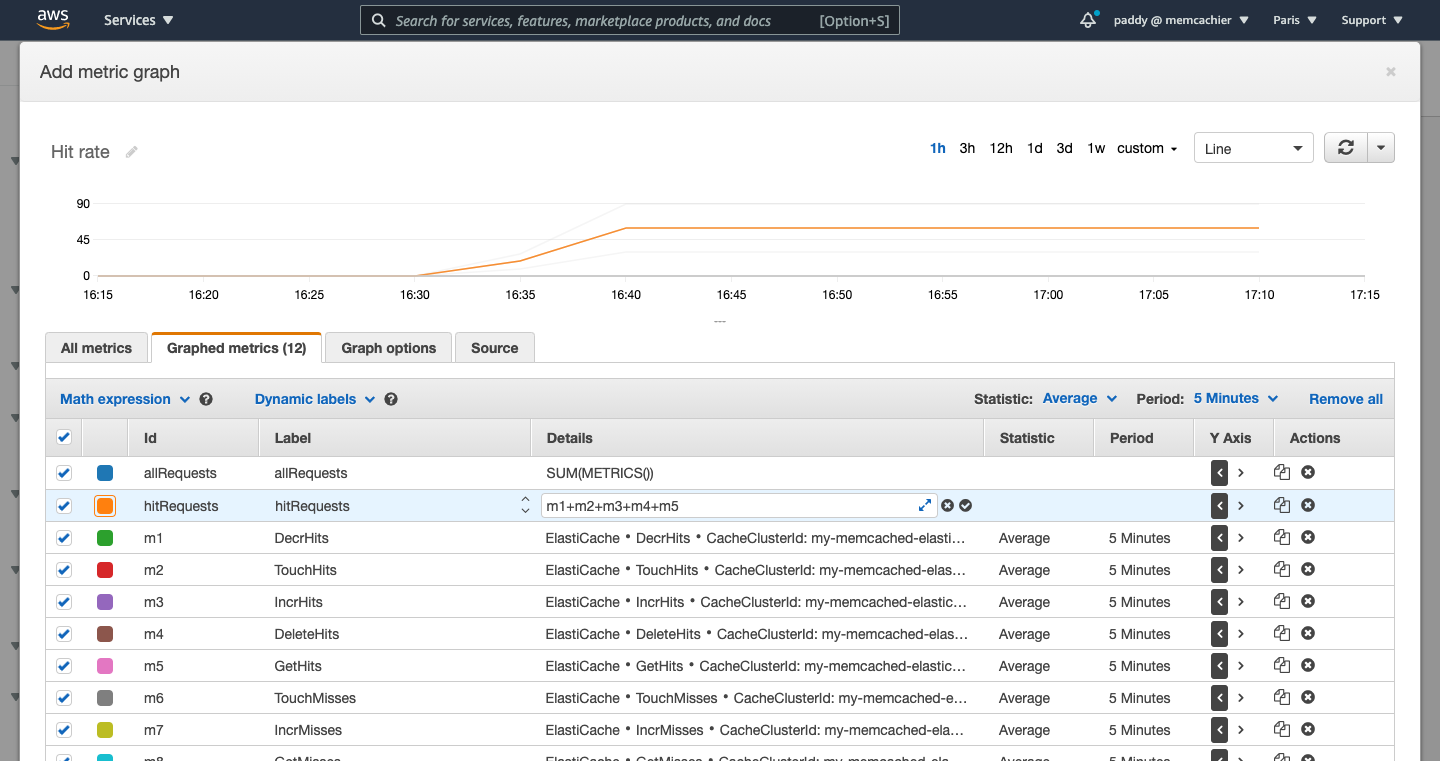
Click ‘Math expression’ again, this time choose ‘Start with empty expression’, and add up the IDs corresponding to your hit metrics. If you followed along and added all 5 hit metrics first, the IDs will be m1 through m5, so your expression will be m1+m2+m3+m4+m5.
Set the ID and Label for this expression to ‘hitRequests’.
Note, instead of manually summing, you could also update the ID of each hit metric to include a common string, e.g. ‘Hits’. So metric IDs could be renamed to touchHits, incrHits, and so on. You could then pass that string to the METRICS() function like so, SUM(METRICS("Hits")), to sum only metric IDs containing that string. The string is case sensitive.
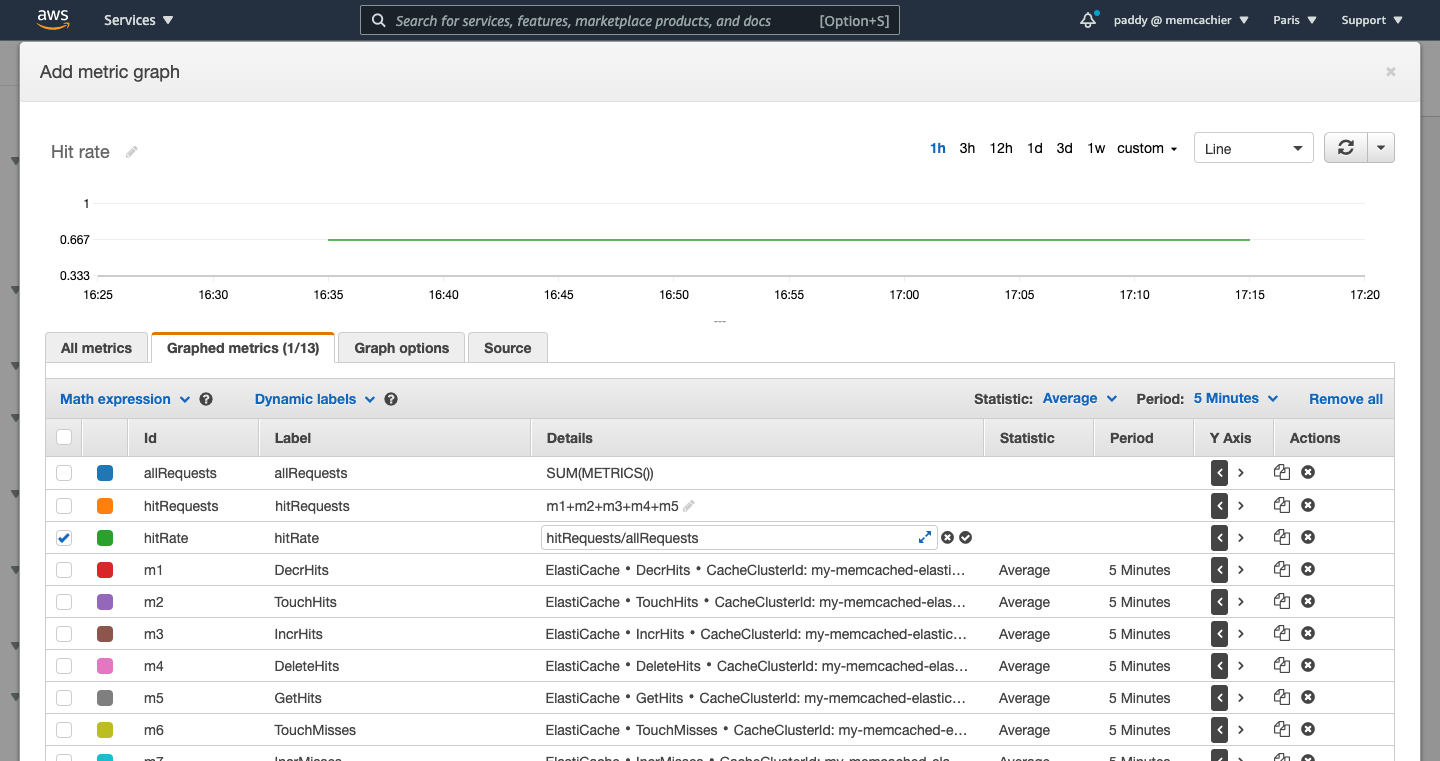
Finally, create another expression to calculate hit rate, hitRequests/allRequests, using the IDs of the two expressions we just created.
Set the ID and Label for this expression to ‘hitRate’.
Note, this expression will give us a hit rate value as a fraction of 1, where 1 equals 100%. To show the value out of 100, just multiply by 100, (hitRequests/allRequests)*100. Units cannot be added to these custom metrics.
Uncheck all metrics and expressions, apart from our hitRate expression to only show the hit rate metric and our graph is complete.
Click ‘Save widget’ to add it to your dashboard, and then click ‘Save dashboard’.
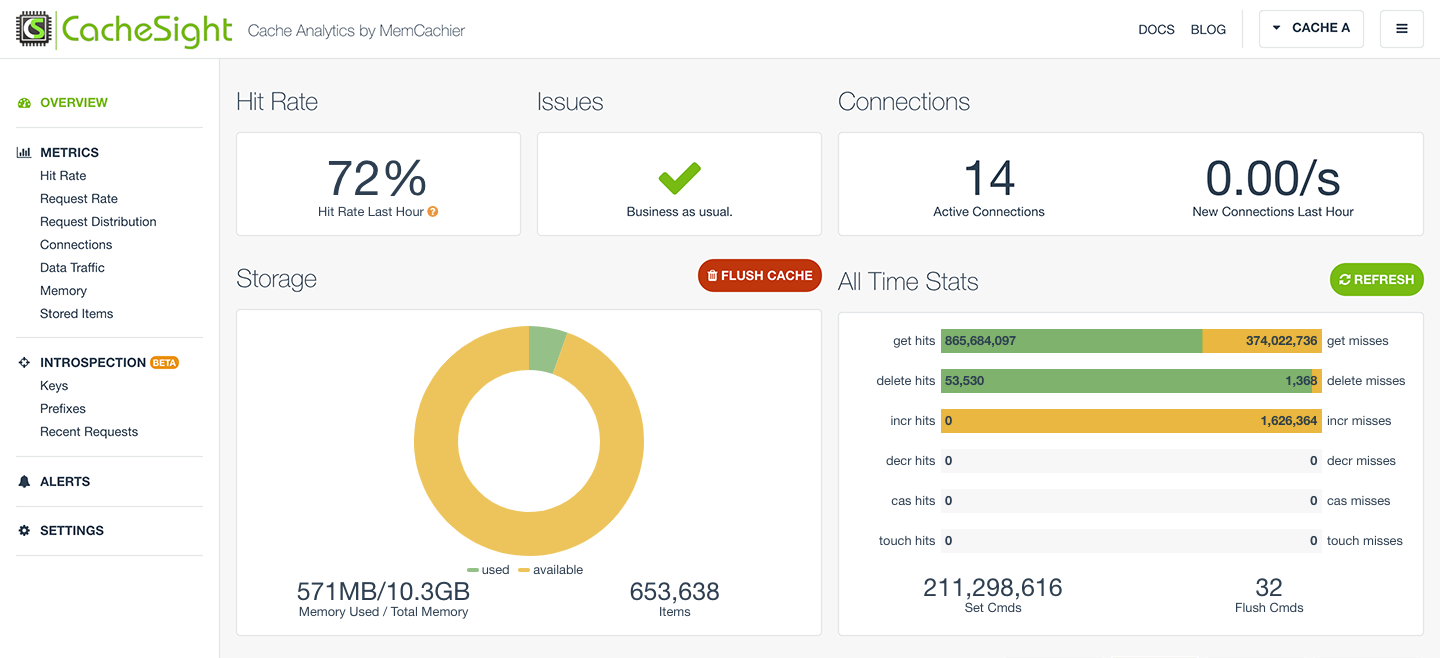
Introducing CacheSight: A CloudWatch alternative for Memcached ElastiCache analytics
If creating your own metrics sounds like a lot of work, CacheSight can help and is free.
CacheSight is a cache analytics service built by the people behind MemCachier, engineers with 10 years of experience in caching. Experience that has gone into selecting the most valuable cache metrics for you.
Also, coming soon is CacheSight Introspection which will allow you to easily
- Assess the performance of different parts of your caching strategy.
- Surface possible bugs in your caching implementation.
Try CacheSight
30-day free trial on AWS
Built by the team behind MemCachier, experts with over a decade of experience offering the most advanced Memcache.