The Cache Dashboard
Overview
The Overview is the default view seen when you select a cache.
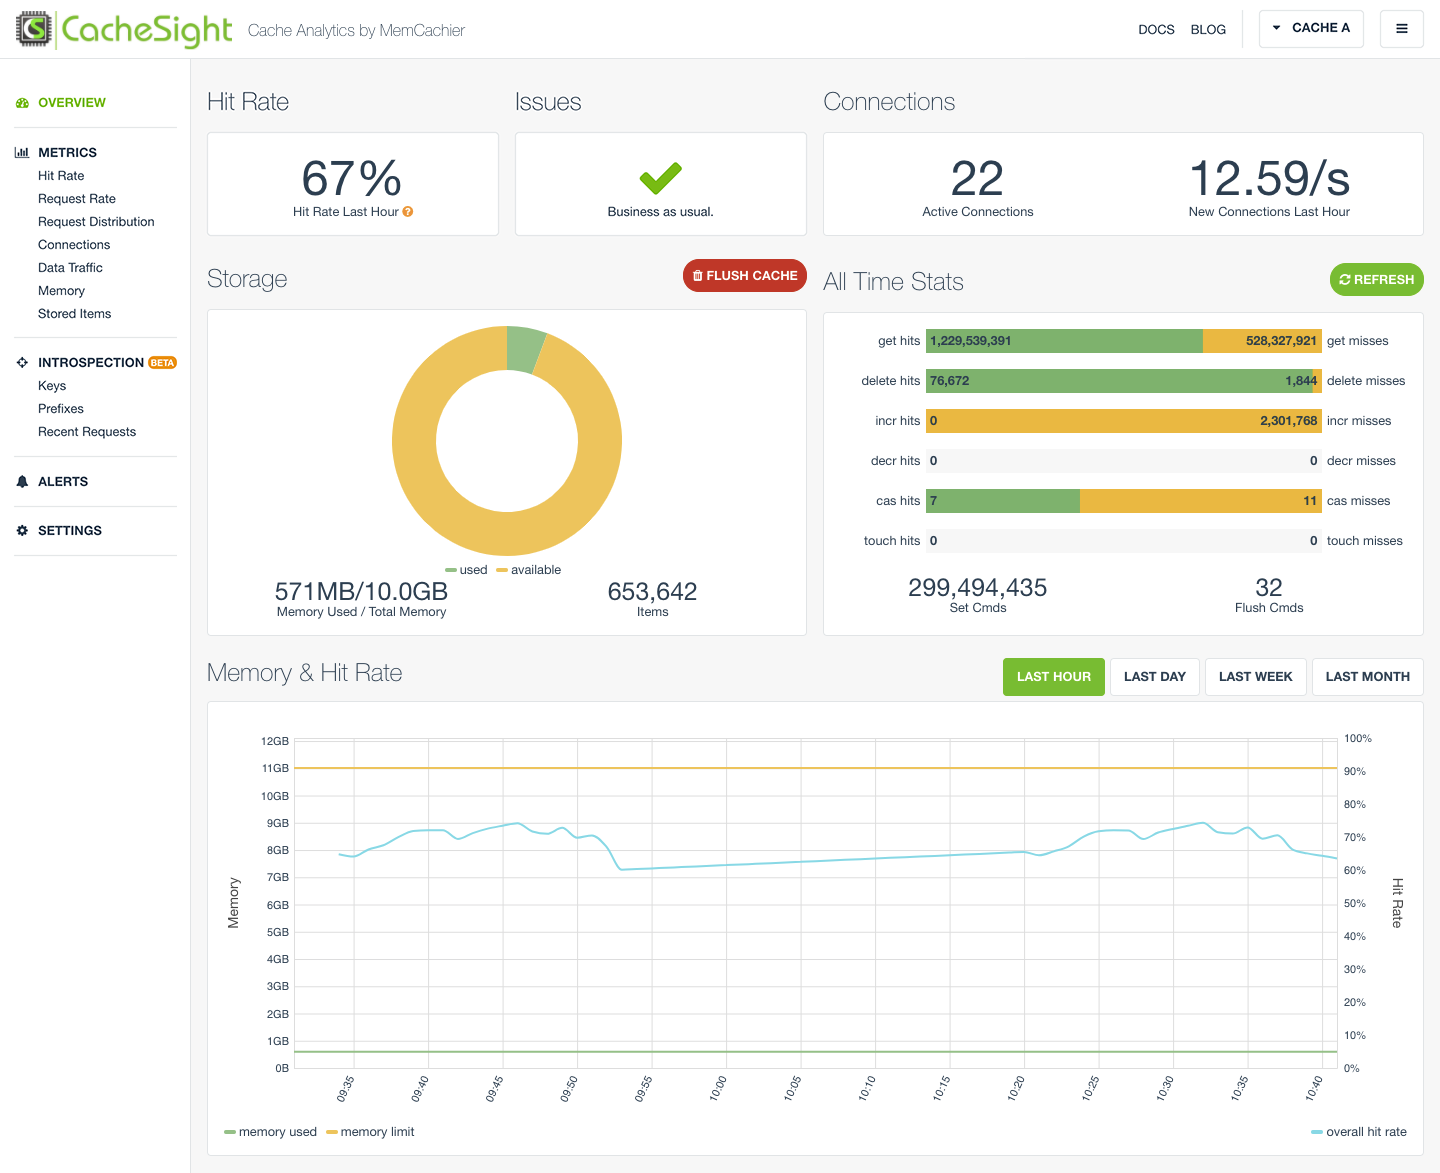
It features the following metrics.
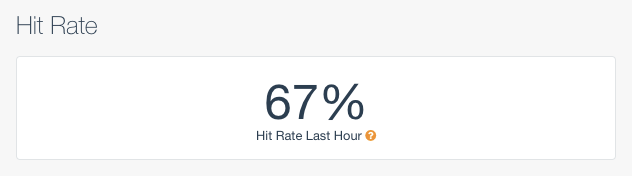
Hit rate (hit ratio)
The Hit Rate card shows the average hit rate for a cache over the last hour. ‘Unavailable’ is shown if no data is available.
Helpful color-coded notices are shown depending on the hit rate value. The ranges are:
>= 80%green (good)>= 50%yellow (average)< 50%red (poor)
Hit rate is calculated by dividing all hit requests by all hit + miss requests.
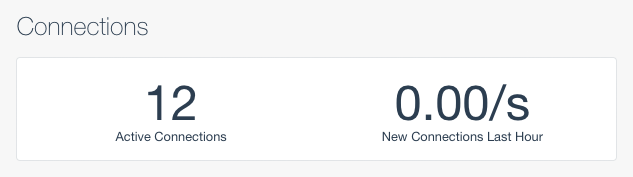
Connections
The Connections card shows two metrics
- Active Connections: the number of current active connections.
- New Connections Last Hour: the rate of new connections per second over the last hour.
If New Connections Last Hour is high (i.e. greater than 10), a helpful warning notice is displayed.
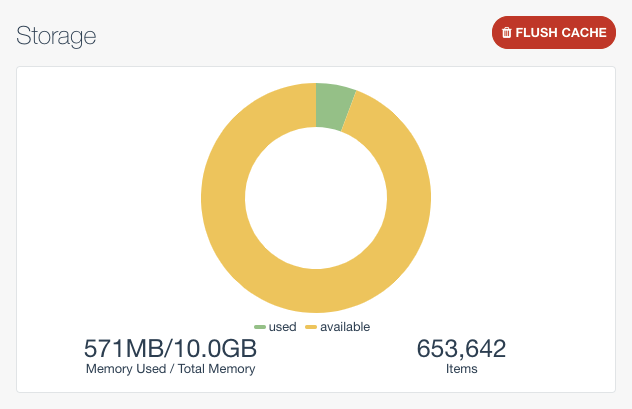
Storage
The Storage card features a FLUSH CACHE button for removing all data from a cache.
Note, be careful when flushing your cache! All data from you cache will be deleted. This action cannot be undone.
A donut chart shows the used memory (green) and available, or remaining memory (yellow) of a cache.
The Memory Used over Total Memory metric is self explanatory. Total memory is the size of your cache.
The Items metric shows the total number of items currently stored in your cache.
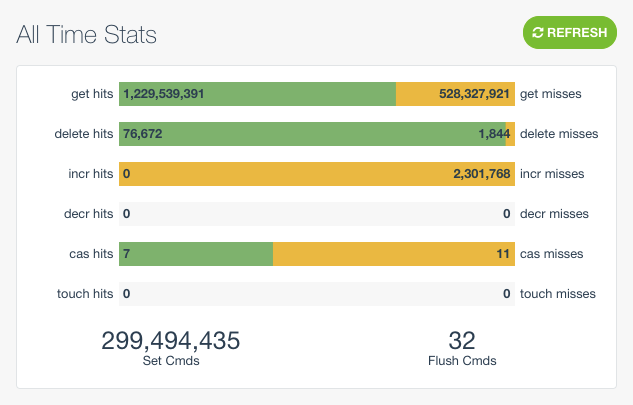
All Time Stats
The All Time Stats card features a REFRESH button for manually updating to see the most recent stats.
Note, stats will auto-refresh approximately every 10 minutes.
The 12 metrics featured in the horizontal bar data visualization, correspond to the standard Memcached stats for requests. i.e hits and misses for the following requests, get, delete, incr, decr, cas and touch. A horizontal bar visually represents a hit rate for each request type, with green for hits and yellow for misses.
Metrics showing the total set and flush commands for a cache are also displayed.
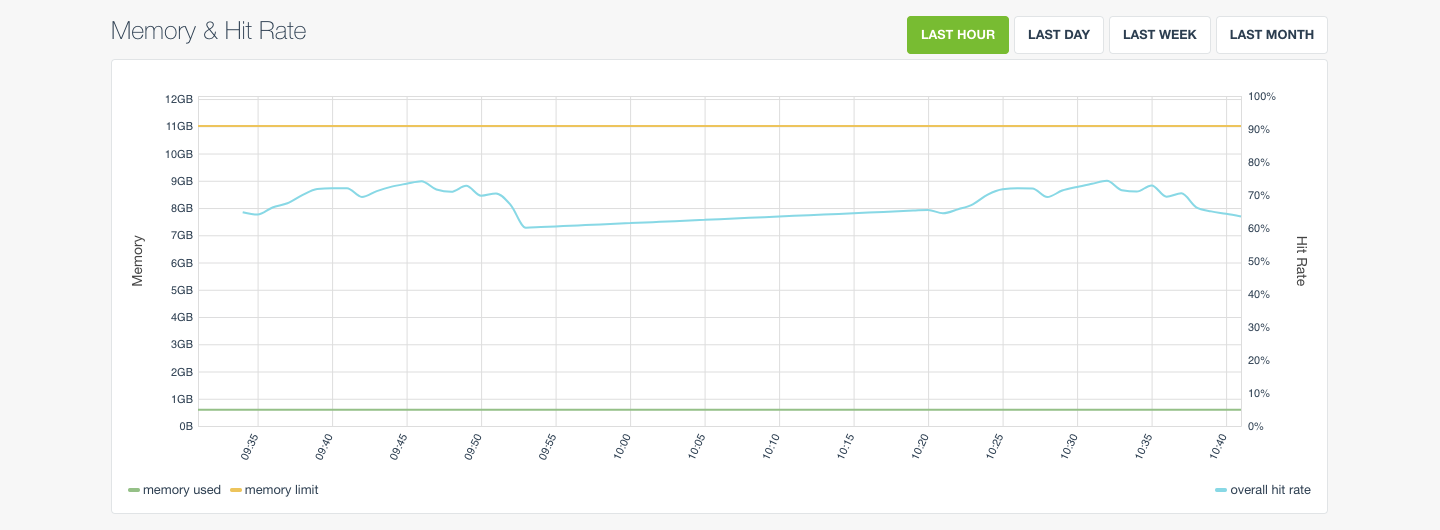
Memory & Hit Rate
The Memory & Hit Rate graph has three lines.
On the left y-axis are memory used (corresponding to Memcache’s bytes stat) and memory limit (corresponding to Memcache’s limit_maxbytes stat)
On the right y-axis is overall hit rate (all hit requests over all hit + miss requests).
Hover over the graph to see a tooltip showing data for the nearest point.
The graph can be filtered by time range, by Last Hour, Last Day, Last Week or Last Month. Last Day is the default. Click one of the time range buttons to show data for a particular time range.
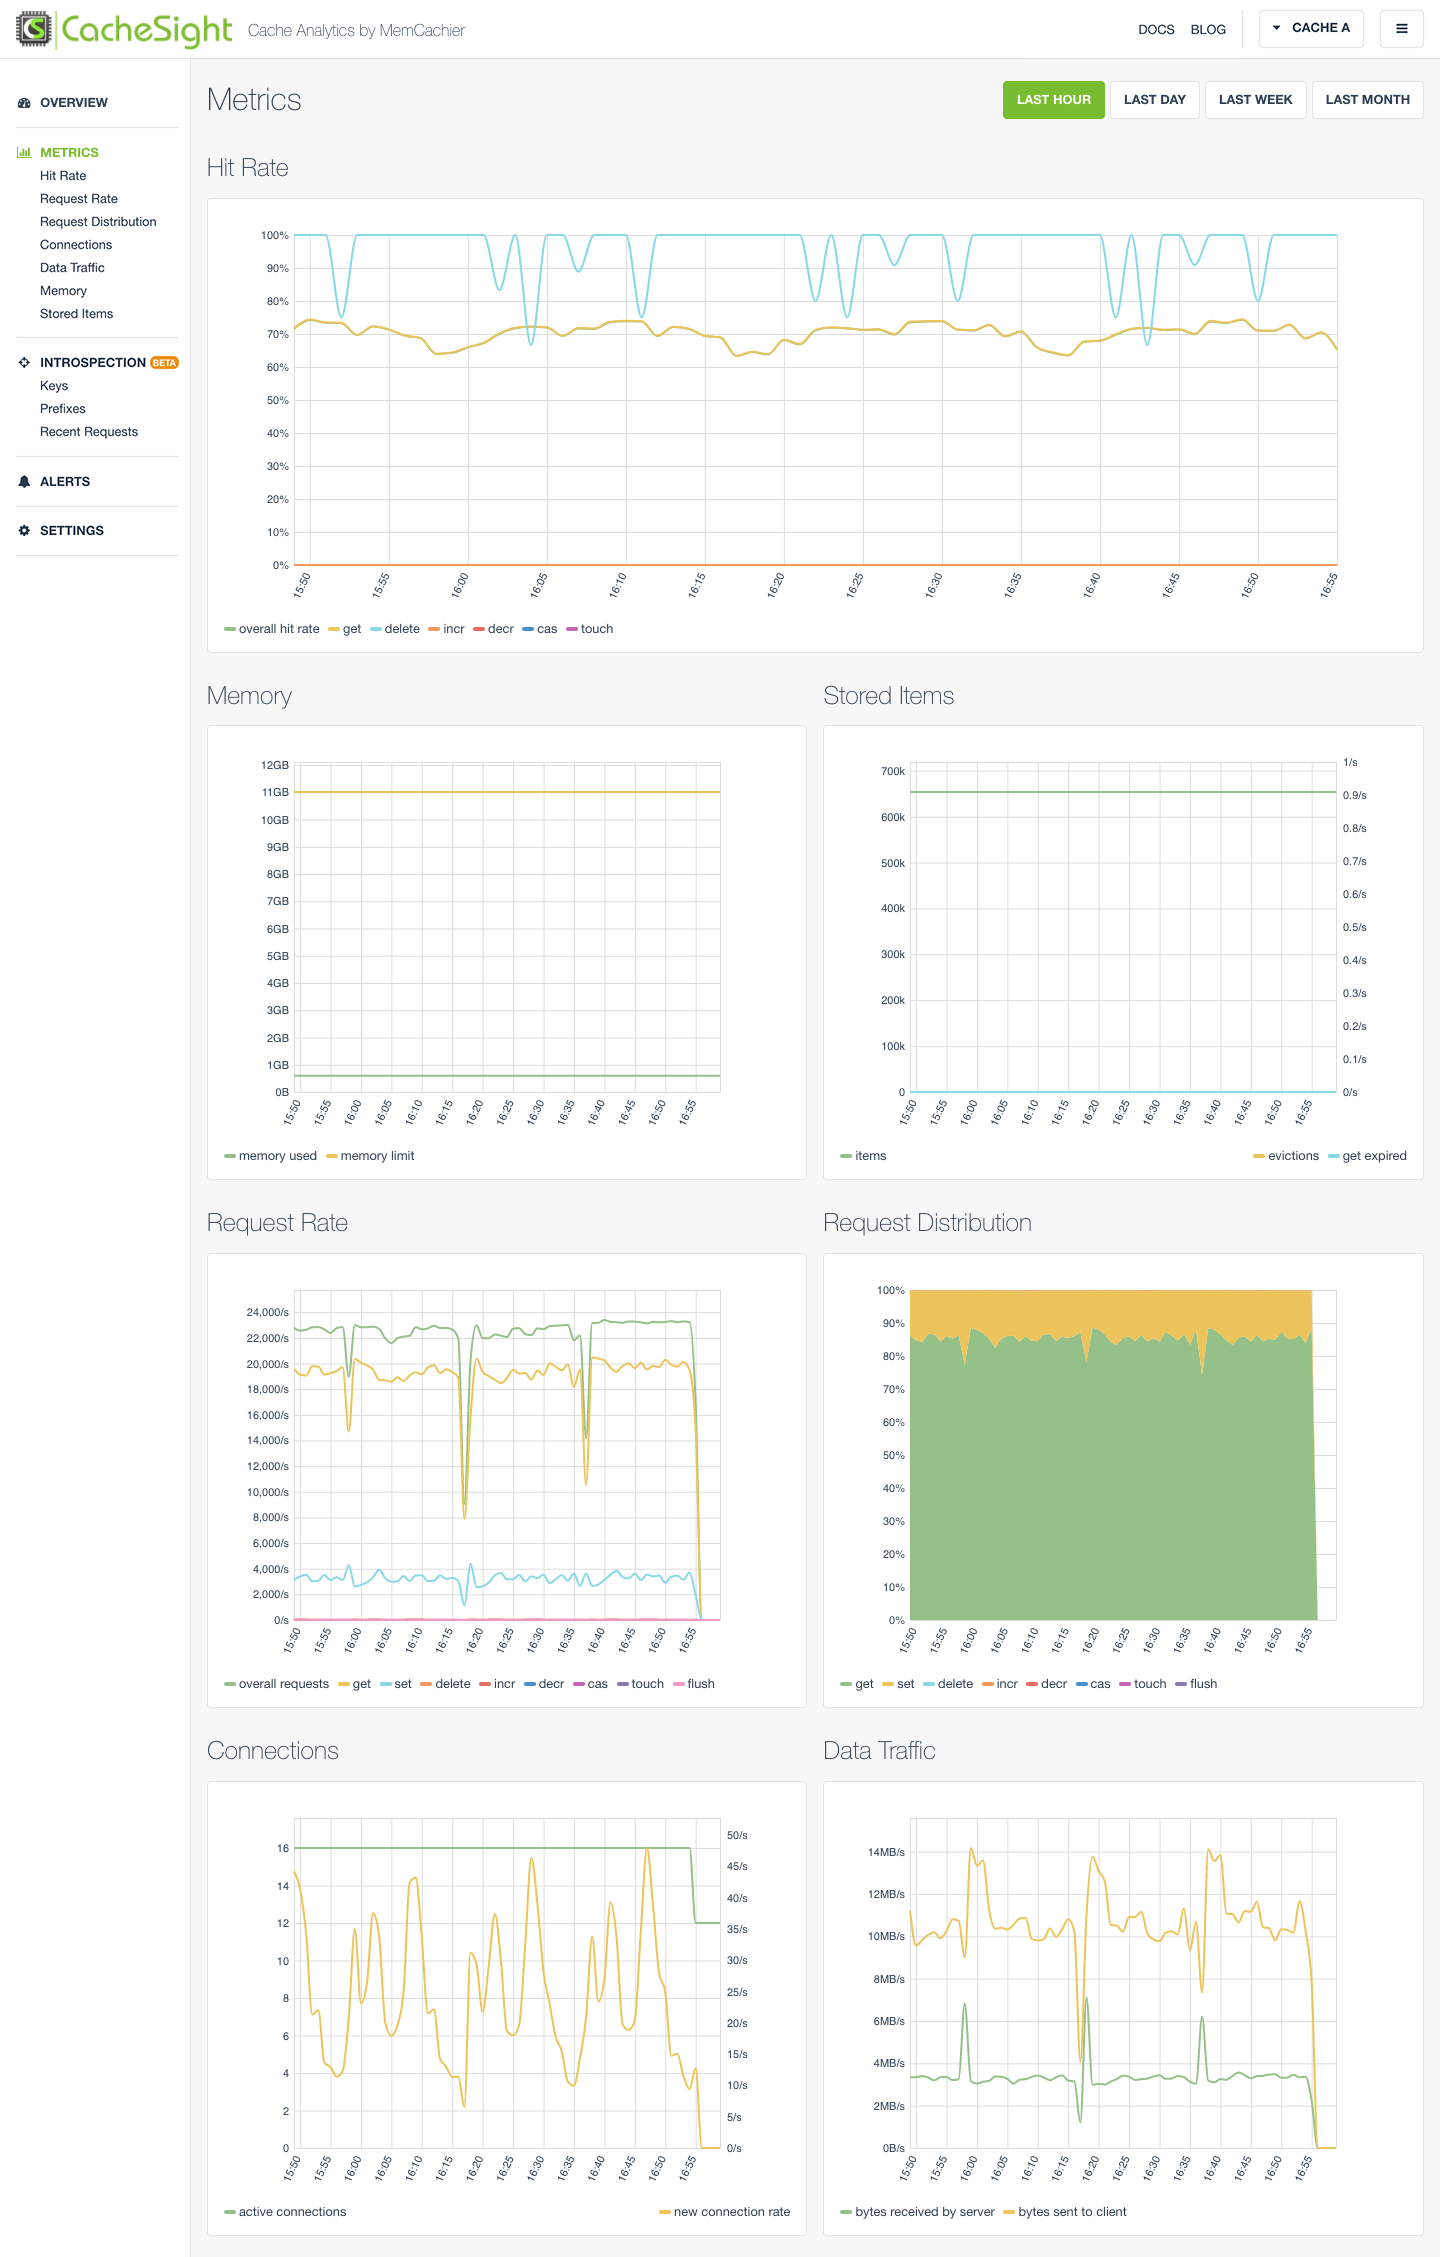
Metrics
The Metrics view displays several graphs. Each graph shows aggregate values for all servers for a cache.
- Hit Rate
- Request Rate
- Request Distribution
- Connections
- Data Traffic
- Memory
- Stored Items
If you’re curious, the aggregate type is average if a graph displays percentage values (i.e. values for each server are averaged). Otherwise the aggregate type is sum (i.e. values for each server are summed up).
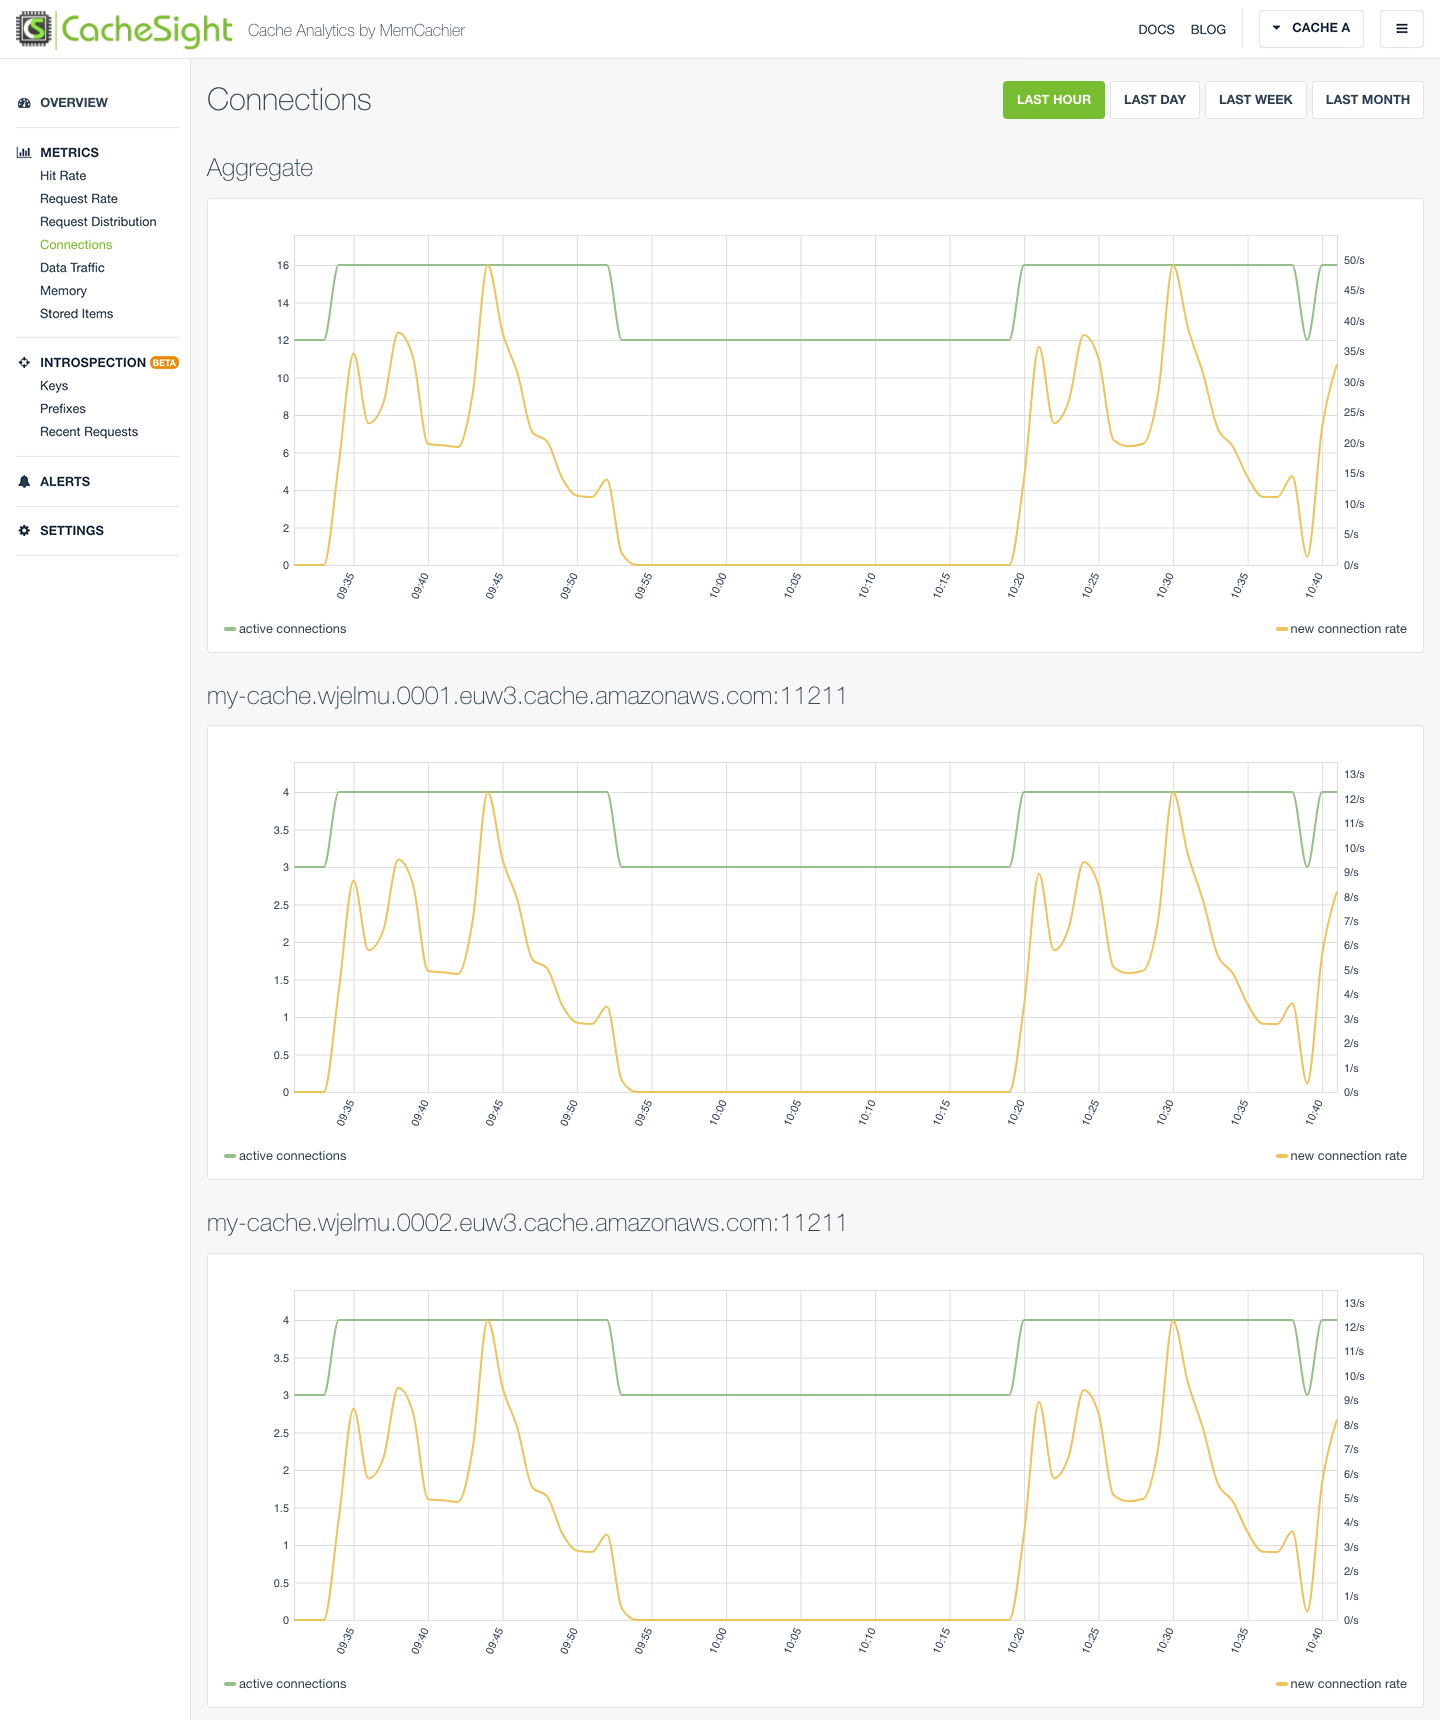
Metrics per server
Each graph on the Metrics view also has a separate corresponding view displaying the same aggregate graph that appears on the Metrics view, followed by a graph per server (if a cache has more than one server).
These views provide server-level insight into a cache.
Introspection
Introspection is our most powerful feature.
Keys
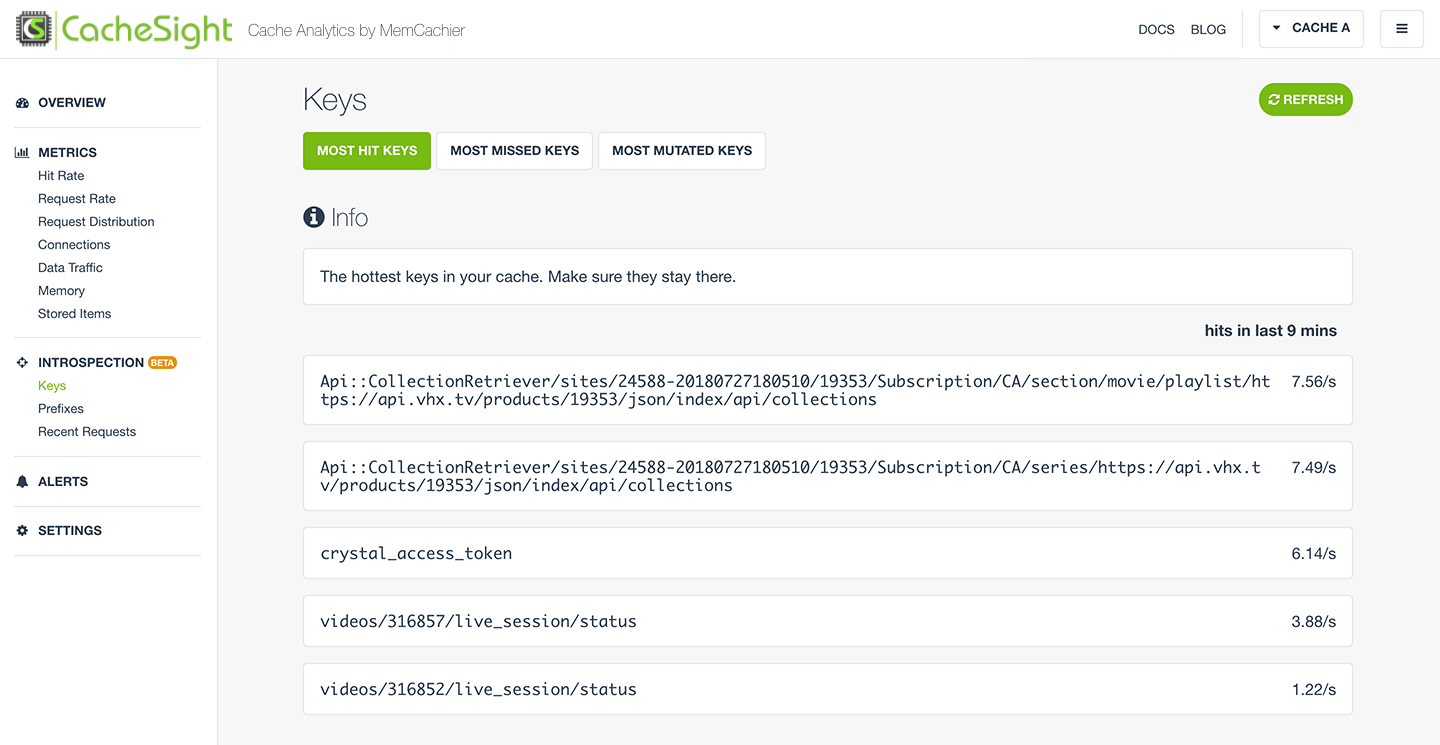
Keys gives you insight into the most popular keys overall in your cache and how they are performing. Three keys’ tabs are available, Most Hit Keys, Most Missed Keys, and Most Mutated Keys.
These same tabs are available for a prefix, giving you the same insight, but specific to keys for a prefix.
Most Hit Keys
Displays the most frequently hit keys in your cache.
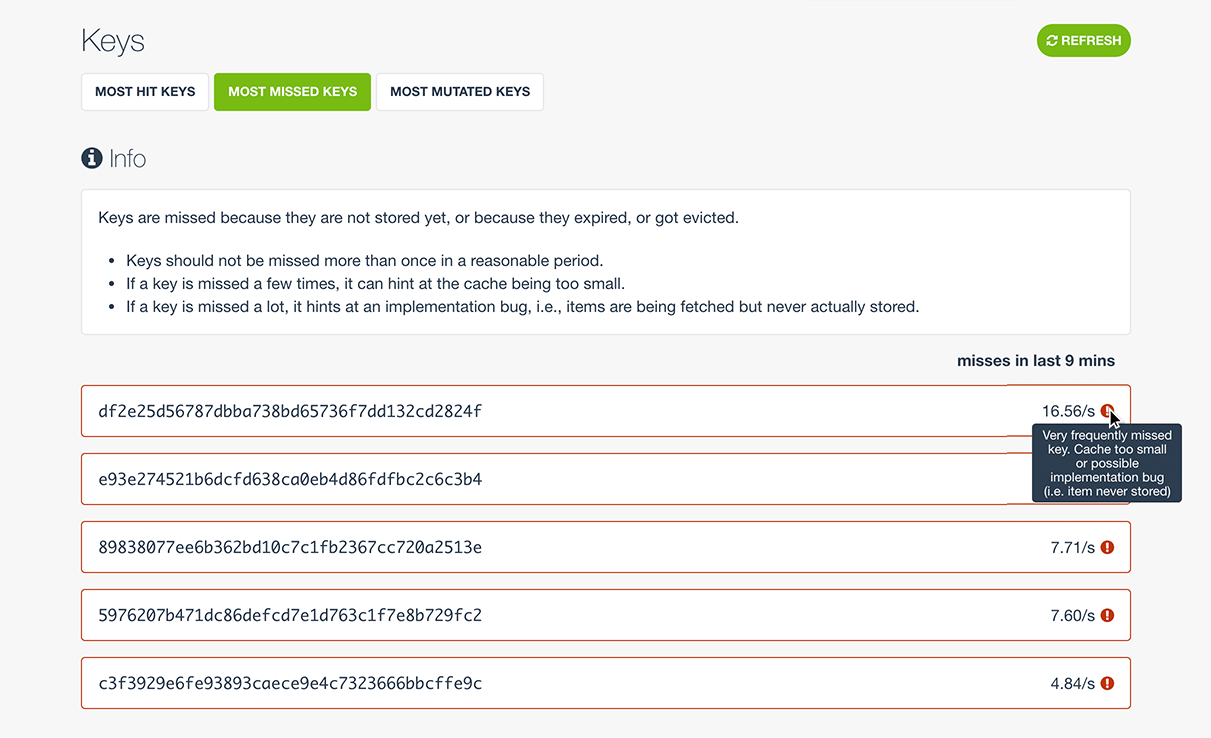
Most Missed Keys
Displays the most frequently missed keys in your cache. Useful for spotting issues, such as a cache being too small, or an implementation bug where items are fetched but never stored.
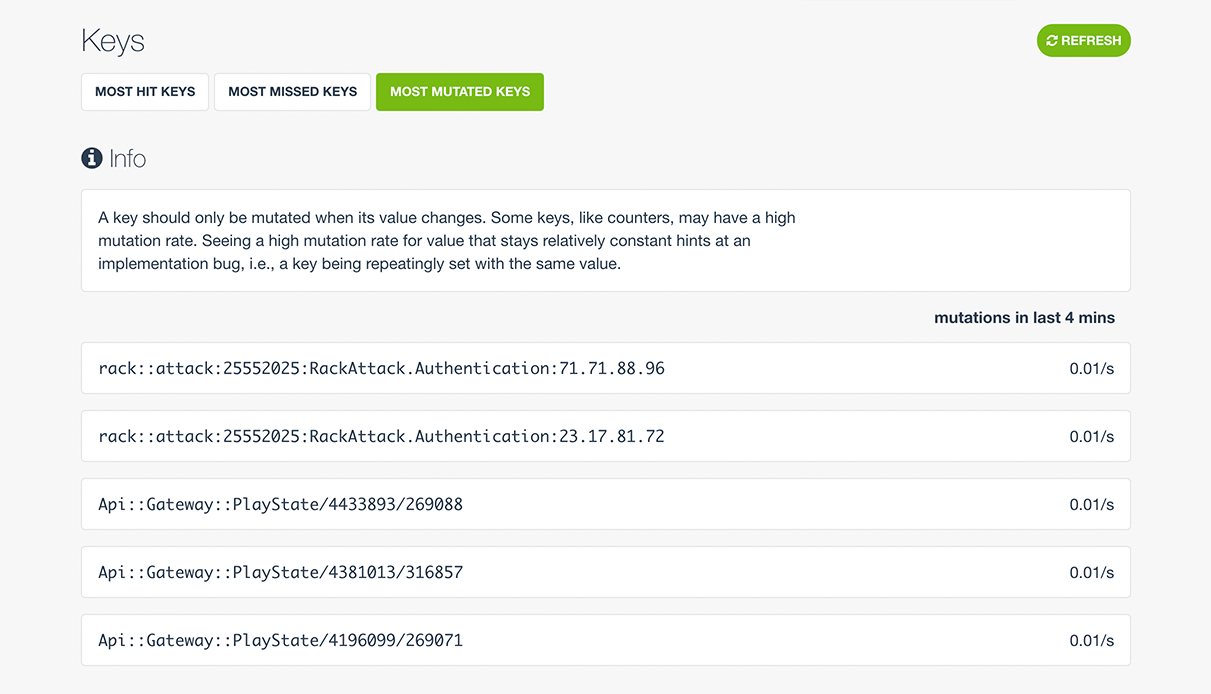
Most Mutated Keys
Displays the most frequently mutated keys in your cache. Useful for spotting issues, such as a high mutation rate for a value that should remain relatively constant, suggesting a key is being set repeatedly with the same value.
Prefixes
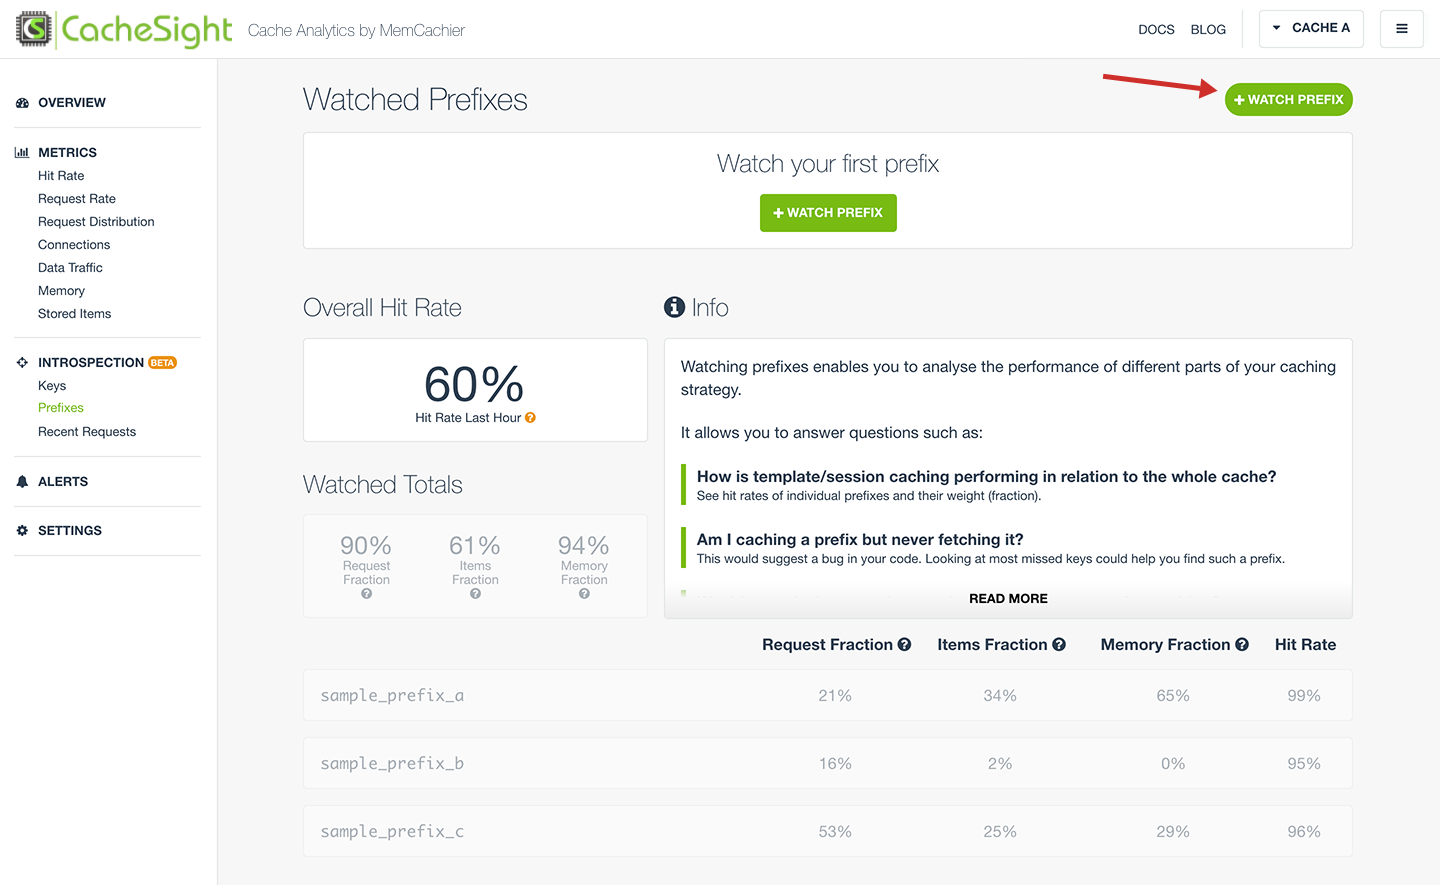
Prefixes is the most powerful feature in CacheSight. Watching prefixes enables you to analyse the performance of different parts of your caching strategy.
A prefix is used to identify groups of keys. Say you need insight into your template caching. If your template keys being with template_, you can watch the template_ prefix to monitor your template caching performance.
Prefixes can help to answer questions such as:
- How is template/session caching performing in relation to the whole cache?
- Am I caching a prefix but never fetching it?
- Would a particular part of my cache benefit from preemtive caching?
- Is it worth caching a certain prefix?
Watch a prefix
To watch a prefix, begin by clicking one of the WATCH PREFIX buttons.
Next, enter the prefix you want to watch, and click SAVE.
I have chosen GlobalCacheStrategy as I know that’s an important prefix for my cache.
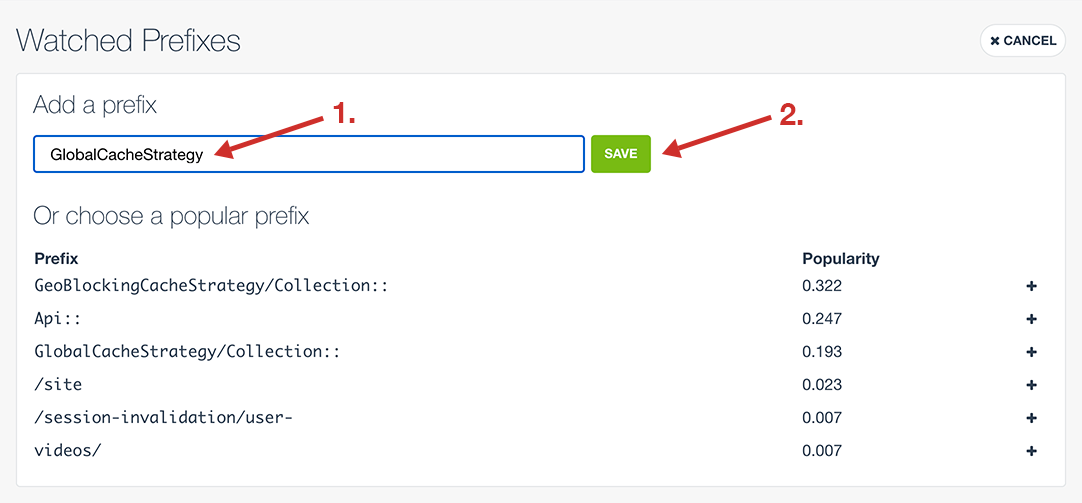
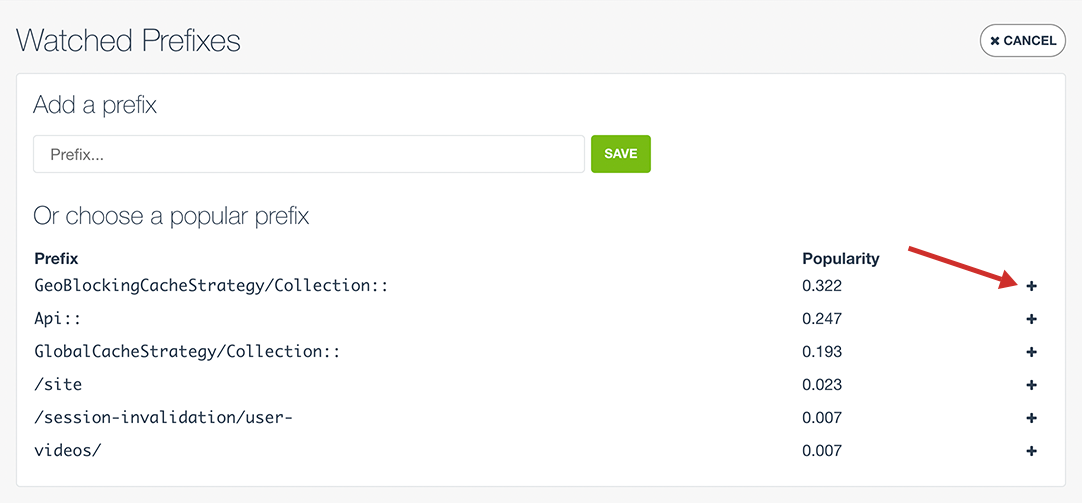
Alternatively, click the plus icon beside a popular prefix to watch it. CacheSight automatically determines the most popular prefixes for your cache.
Once you have added your first prefix you will notice the grayed out sample data gets replaced by your prefix. Within about 15 minutes you should start seeing data for your prefix.
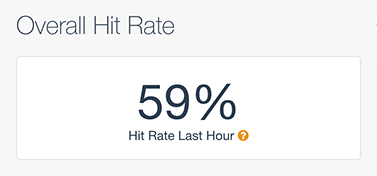
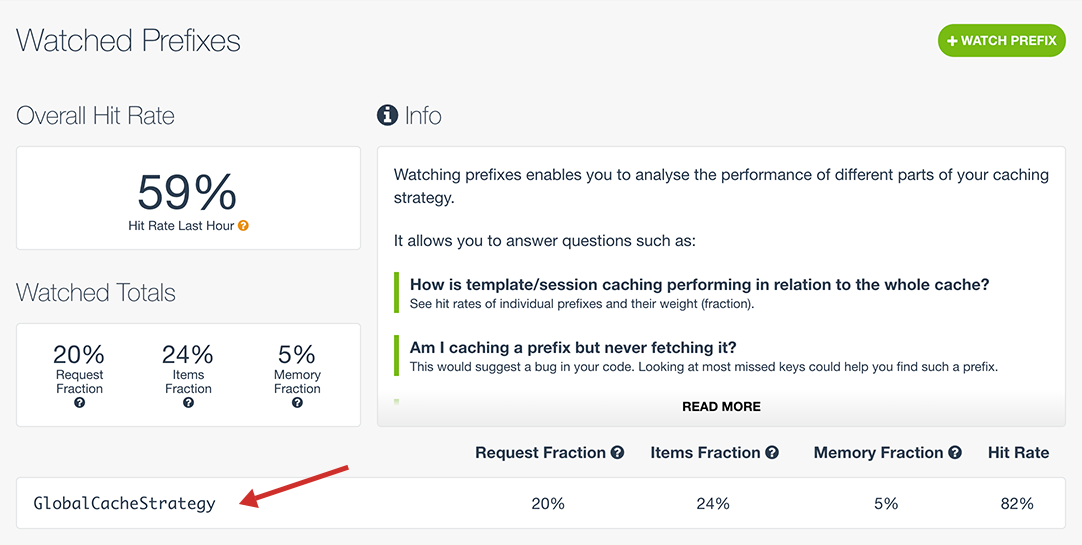
Overall Hit Rate
The overall hit rate metric here is exactly the same as the overview hit rate.
Watched Totals
Watched Totals will be available once at least one prefix had been added. They show Request Fraction, Items Fraction and Memory Fraction for all watched prefixes. These of course become more interesting once you’re watching more than one prefix.

Prefix Stats (Summary)
For each prefix a Request Fraction, Items Fraction, Memory Fraction and Hit Rate stat is shown.
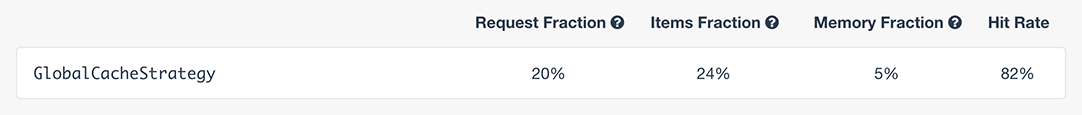
Request Fraction
The percentage of recent requests that belong to a prefix. This metric tells you what fraction of your cache is preoccupied with a given prefix.
Items Fraction
The percentage of recent active items that belong to a prefix.
Memory Fraction
The percentage of recent active memory that belong to a prefix.
Prefix Hit Rate
Like your overall cache hit rate, a prefix hit rate is calculated by dividing all hit requests by all hit + miss requests for a specific prefix. This metric is especially important for determining the performance of a prefix.
Prefix Stats (Detailed)
To view detailed stats, click on a prefix.
Prefix Overview
The Prefix Overview displays all stats for a prefix.
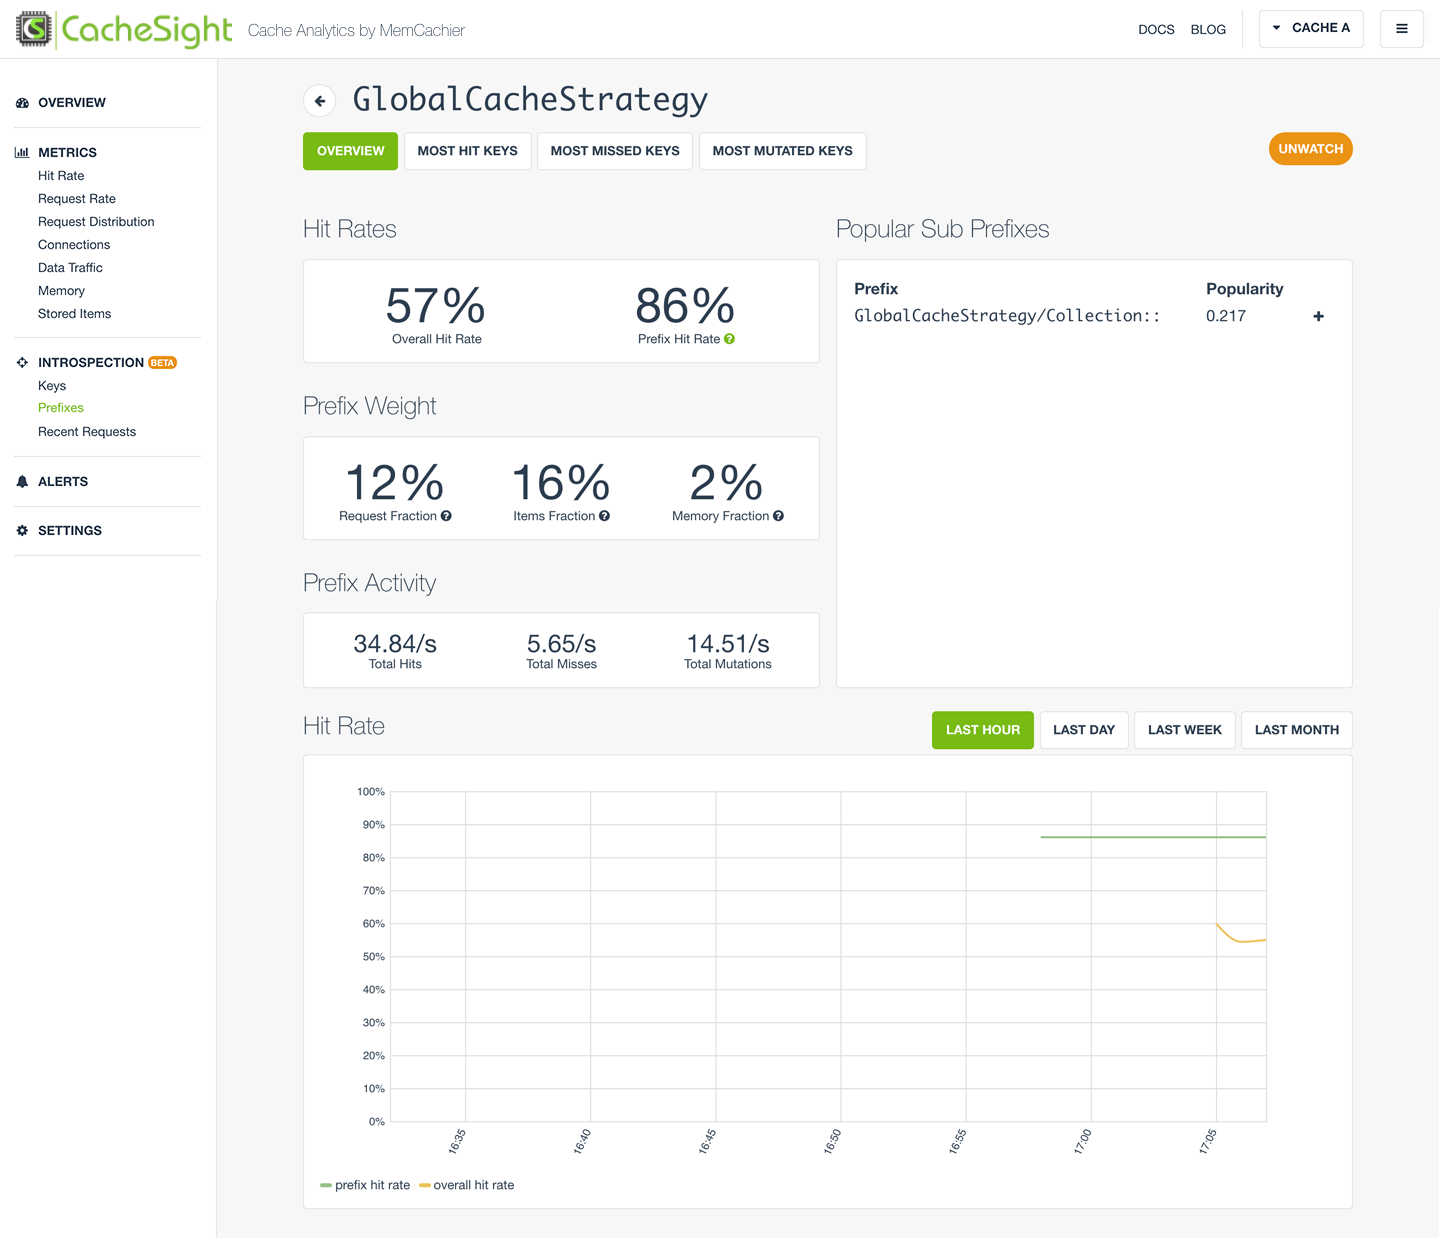
The Hit Rates card displays overall hit rate side by side with the prefix hit rate. A corresponding chart is displayed below showing historical data for the same metrics.
The Prefix Weight card displayed the same Request Fraction, Items Fraction and Memory Fraction metrics, as shown in the Prefix Stats summary on the Prefixes view. A corresponding chart is displayed below showing historical data for the same metrics.
The Prefix Activity card shows recent values for Total Hits, Total Misses and Total Mutations as a per second rate. A corresponding chart is displayed below showing historical data for the same metrics.
The Prefix Request Fraction charts displays stats for total hits fraction, total misses fraction and total mutations fraction. These stats do not appear in the cards above. The stats show prefix requests as a percentage of overall requests. For example, total hits fraction shows prefix hits as a percentage of overall hits.
Prefix Keys
Three keys’ tabs, Most Hit Keys, Most Missed Keys, and Most Mutated Keys, are available for a prefix. These provide the same utility as the overall Keys view.
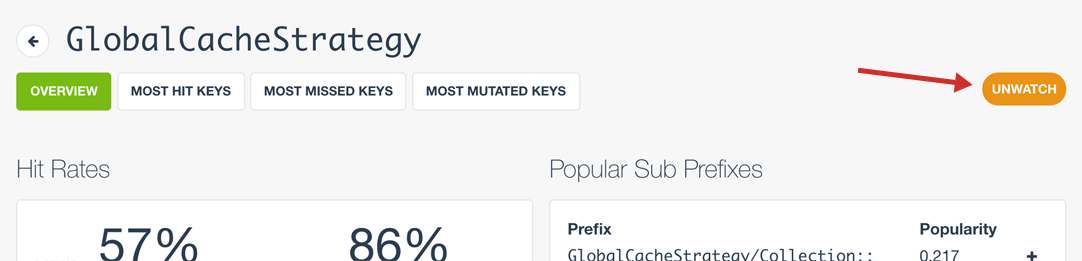
Unwatch Prefix
To stop watching a prefix, click the “UNWATCH” button on the Prefix Overview view. Note, all data for that prefix will be deleted.
Note, this action is permanent and cannot be undone!
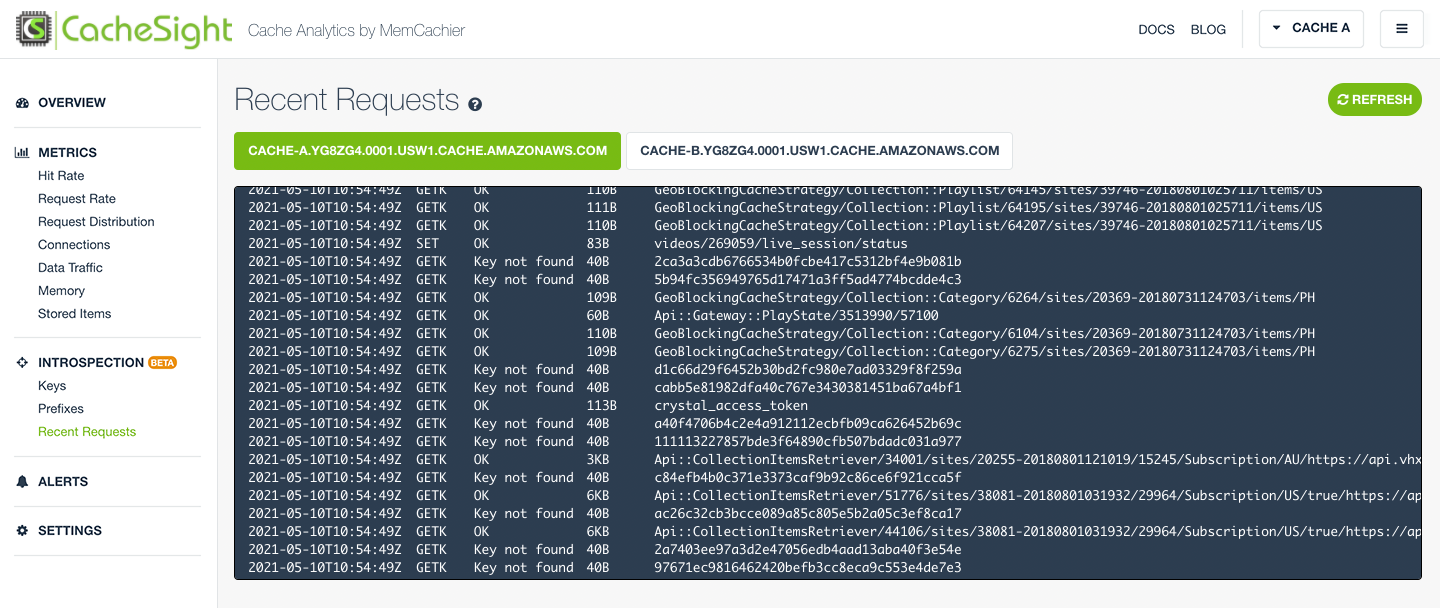
Recent Requests
Recent Requests displays the last 100 requests from your cache’s logs. It is useful for quick debugging and making sure your cache is working as expected.
Logs are displayed for individual cache servers on separate tabs.
Alerts
Alerts can be created for hit rate or memory usage and can be delivered by email or Slack.
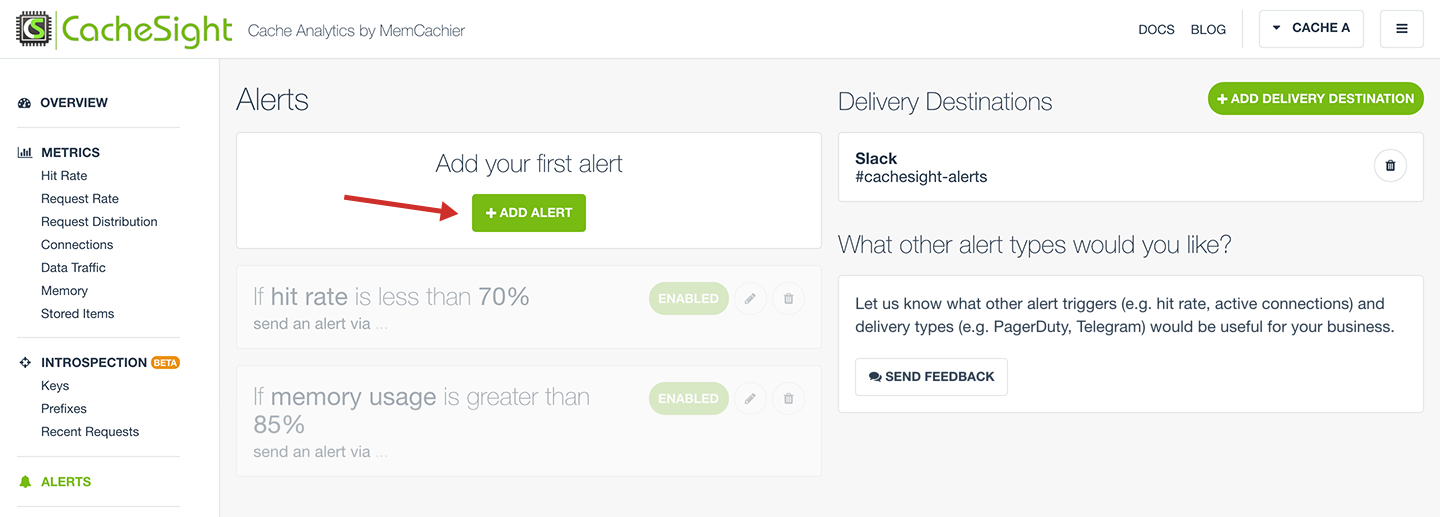
To start adding alerts, first create a delivery destination.
Add a delivery destination
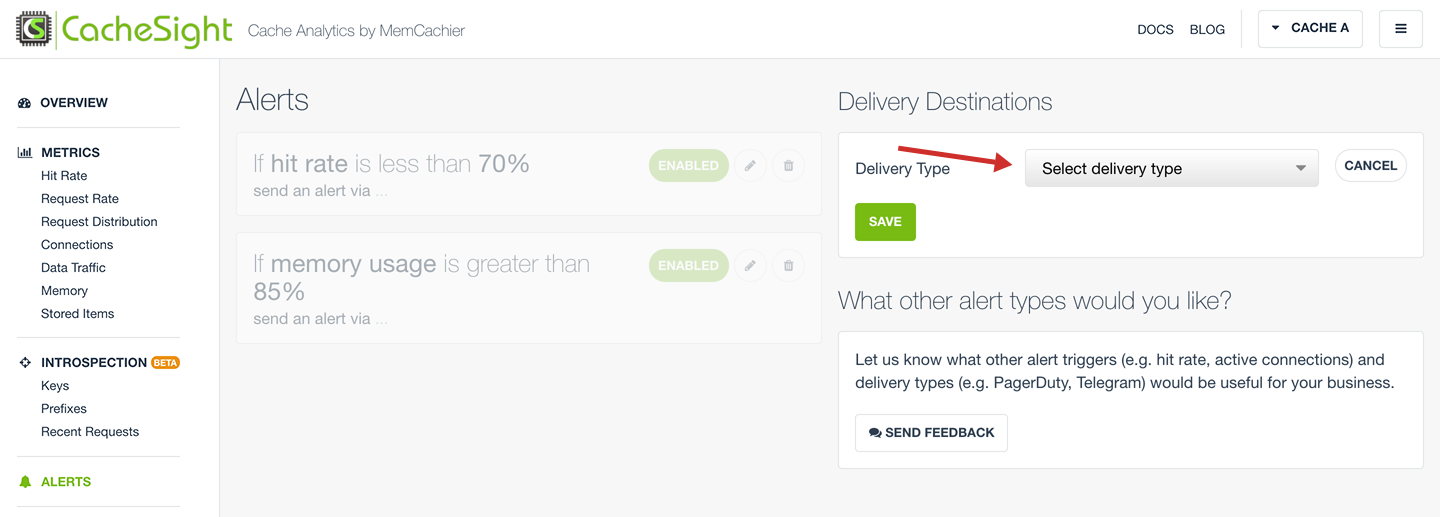
Start by clicking ADD DELIVERY DESTINATION. This will display a form for adding a delivery destination.
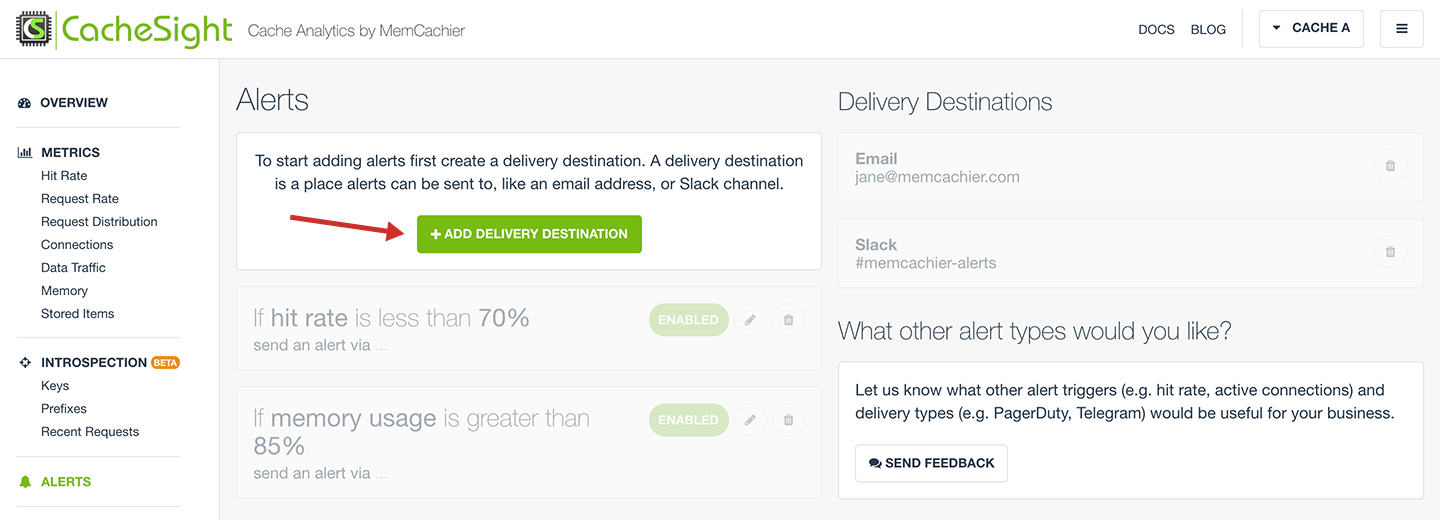
Select the delivery type you wish to add. There are two options, email or Slack.
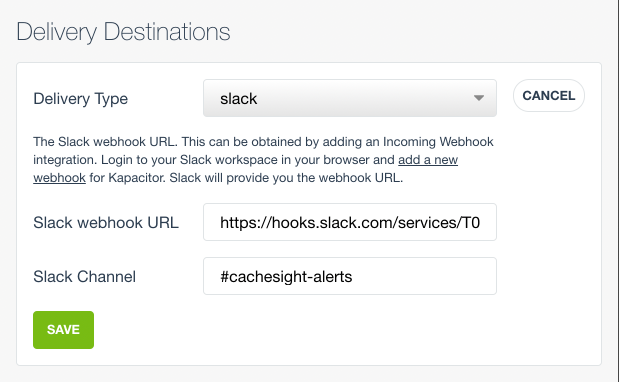
Add a Slack delivery destination
We’ll go through the steps to a Slack delivery destination first.
Create a new channel in Slack, or use an existing one. The channel will be used to receive CacheSight alerts. I’ve named mine #cachesight-alerts.
Next, create a Slack webhook for your channel. To do that, login to your Slack workspace in your browser and add a new webhook.
Once created, copy the webhook URL and paste it into the Slack webhook URL field back in CacheSight. It will look something like this https://hooks.slack.com/services/xxx/yyy/zzz.
Finally, add your channel in the Slack Channel field, including the #, e.g. #cachesight-alerts, and click SAVE.
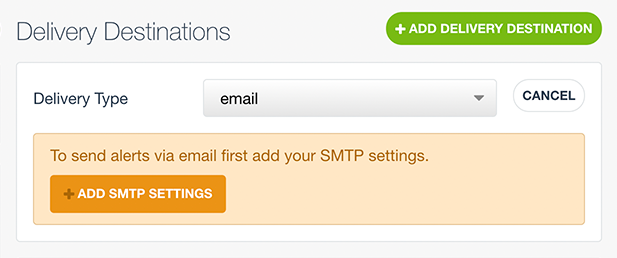
Add an email delivery destination
After clicking ADD DELIVERY DESTINATION, select the email delivery type.
You can only create email alerts once your SMTP settings are configured. Click ADD SMTP SETTINGS to do so.
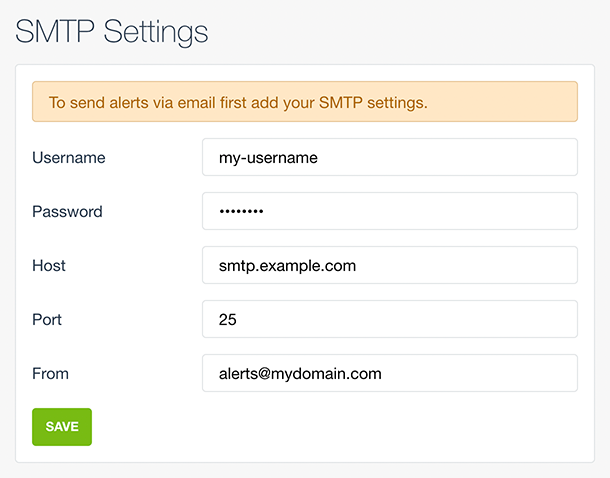
Add SMTP Settings
Enter your SMTP settings and add a From email address. This is the address email alerts will be sent from.
Click SAVE.
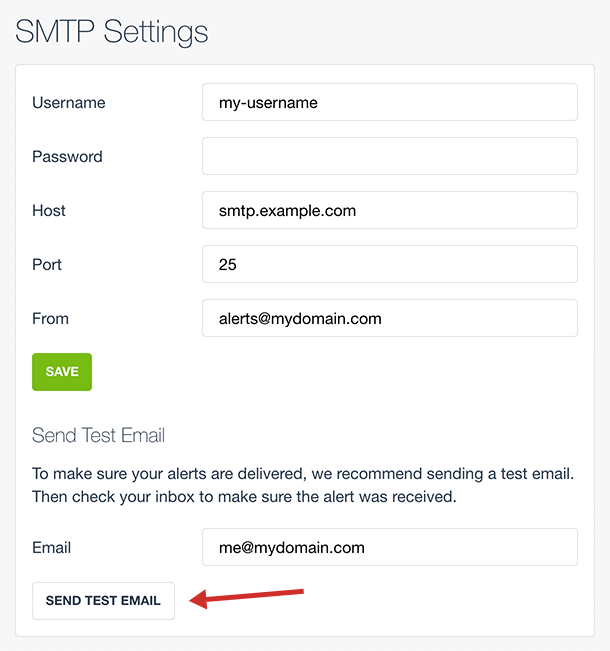
Test your SMTP settings
After adding your SMTP settings you will be able to send a test email. We recommend doing this to make sure your alerts are delivered.
Enter an email address and click SEND TEST EMAIL. Then check your inbox to make sure the email was received.
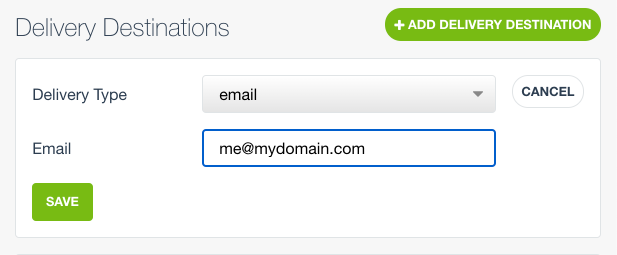
Add delivery destination
Navigate back to the Alerts view for the cache you wish to create an email alert for.
Click ADD DELIVERY DESTINATION and select email as a Delivery Type. Now, with SMTP settings configured, you will be able to enter an email address.
Finally, click SAVE.
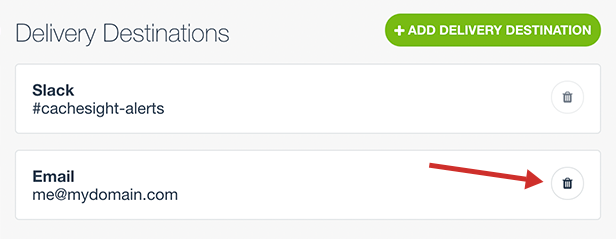
Delete a delivery destination
Delivery destinations can only be deleted when they are not in use by any alerts.
Click the trash icon of a delivery destination to delete it.
Add an alert
Once you have at least one delivery destination, you can create alerts. Click ADD ALERT to begin.
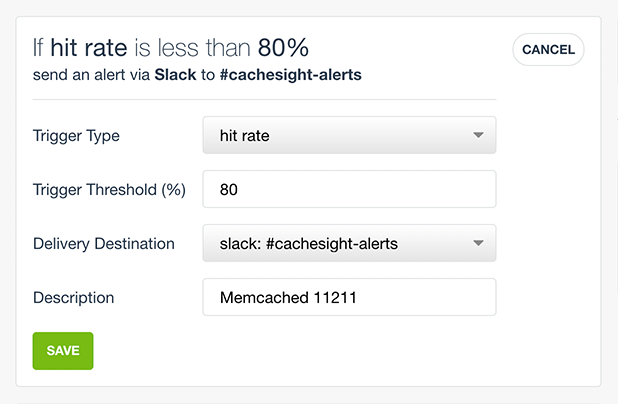
Create a hit rate alert
Let’s create a hit rate alert first. In the add alert form, select hit rate as the Trigger Type.
Choose a Trigger Threshold. I’ve chosen 80%, so it my cache hit rate is less than that value the alert will be triggered.
Select a Delivery Destination. I’ve chosen the Slack destination I just created.
Enter a Description. I’ve left the default in place, the cache name.
Finally, click SAVE to create the alert.
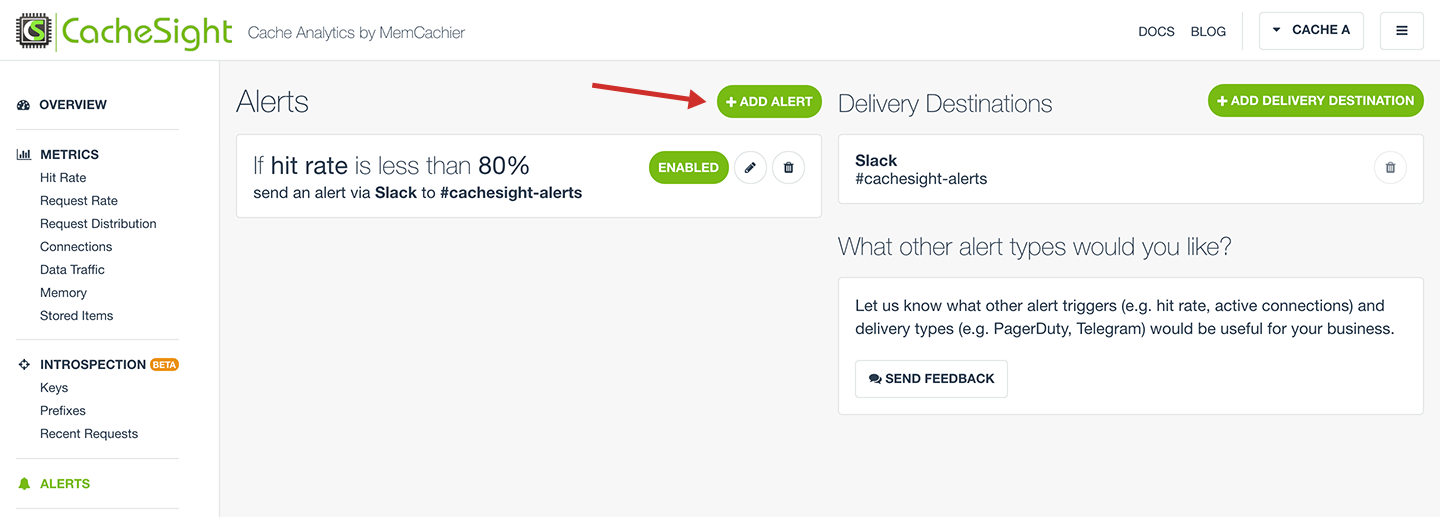
Create a memory usage alert
Creating a memory usage alert is similar to creating a hit rate alert. Click ADD ALERT to begin.
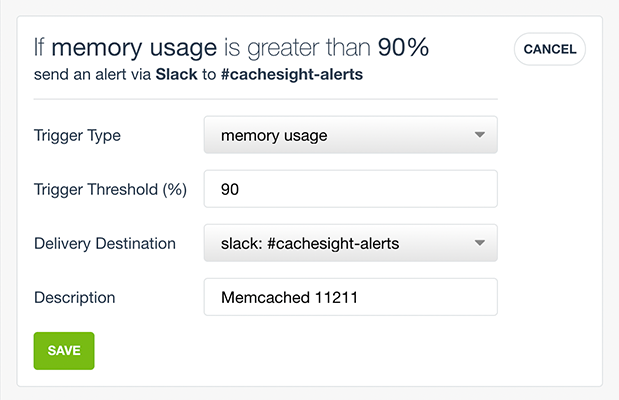
In the add alert form, select memory usage as the Trigger Type.
Choose a Trigger Threshold. I’ve chosen 90%, so it my cache memory usage is greater than that value the alert will be triggered.
Select a Delivery Destination. I’ve chosen the Slack destination I just created.
Enter a Description. I’ve left the default in place, the cache name.
Finally, click SAVE to create the alert.
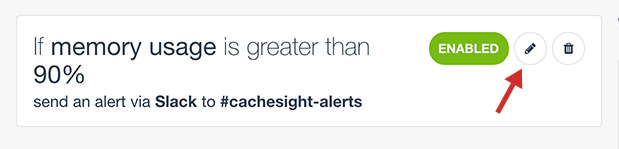
Update an alert
To update an alert, click the pencil icon of the alert you’d like to update. Make your changes, and click SAVE.
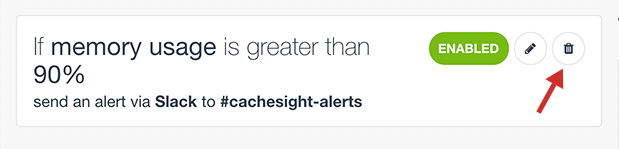
Delete an alert
To delete an alert, click the trash icon of the alert you’d like to update.
Note, this action is permanent and cannot be undone!
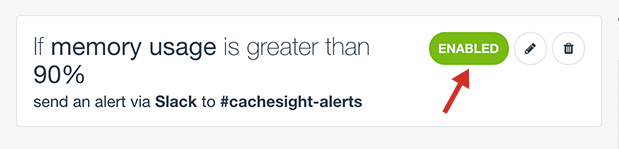
Disable/Enable an alert
Alerts are enabled by default when they are created. To disable an alert, click the ENABLED button of the alert you’d like to disable. The button will then read DISABLED. Click again to re-enable.
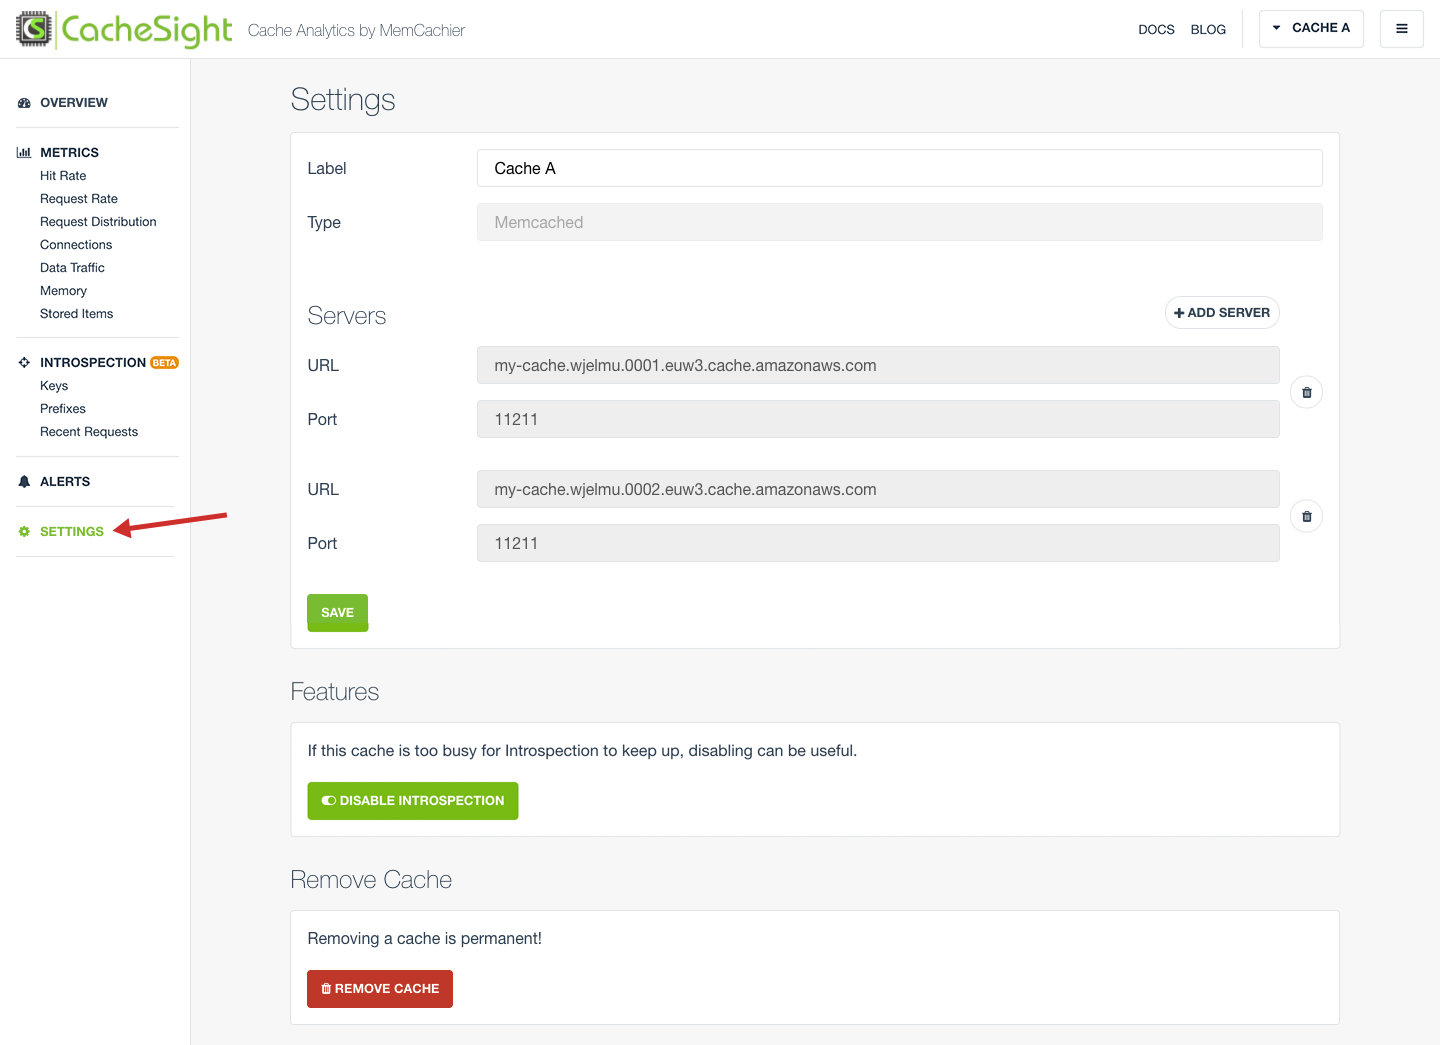
Settings
To view settings for a cache click on SETTINGS in the left hand horizontal menu.
From the Settings view you can change the Label of your cache, add or remove Servers, or remove your cache permanently.
Change label
To change the Label of a cache, change the label’s value and click SAVE.
Note, cache Type cannot be changed.
Update servers
Servers can be added or removed, but not updated. A cache must have at least one server.
To replace a server, add a new one first, then delete the old.
Add a server
To add a new server, click the ADD SERVER button.
Enter a URL and a port for the new server, and click SAVE.
Remove a server
Once there are at least two servers, a trash icon button will appear beside each set of server fields (URL and Port). Clicking the trash icon will remove a set of fields.
Disable Introspection
If Introspection is available with your AMI, it can be enabled or disabled. With proper machine sizing this should not be necessary.
Delete a cache
To delete a cache, click the REMOVE CACHE button.
Note, this action is permanent and cannot be undone!